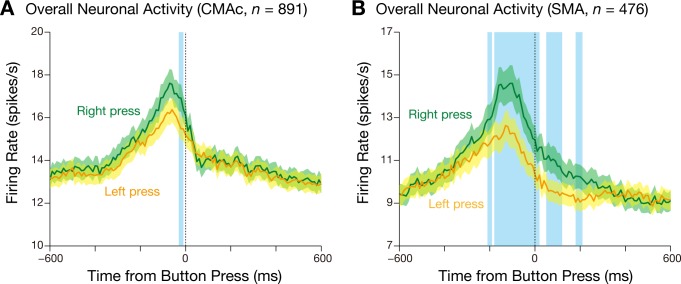
Fig. 3.
Mean firing rate (±SE; bin width = 10 ms) of all task-related neurons in the CMAc (A) and SMA (B) for the right-press (green) and left-press trials (orange). The blue translucent areas indicate 10-ms bins in which the firing rate for the right-press trials differed from that for the left-press trials (paired t-test, α = 0.01) in two or more consecutive bins.

