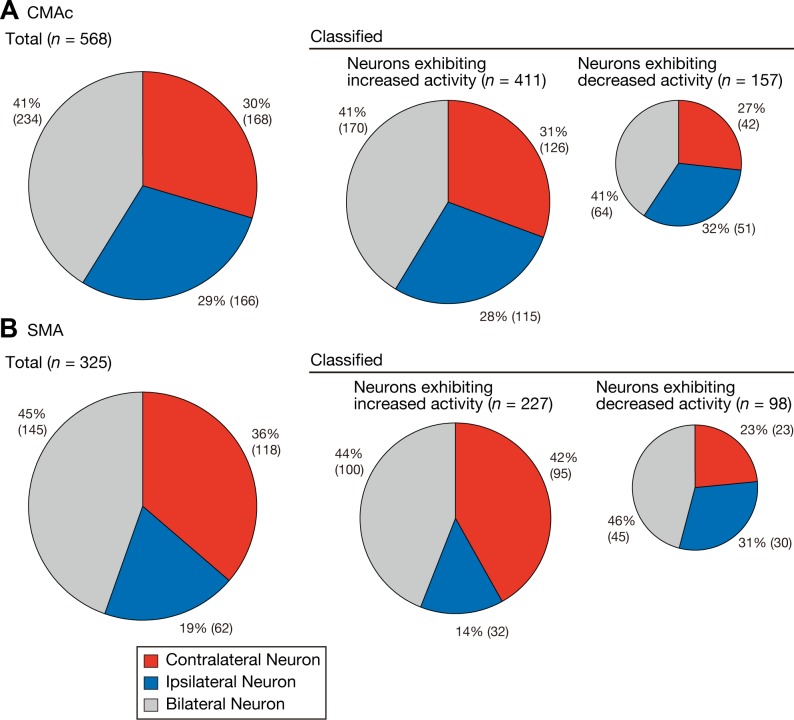
Fig. 4.
Frequencies of neurons selective for contralateral, ipsilateral, or bilateral movements. The pie charts summarize the proportions of neurons in the CMAc (A) and SMA (B) that were classified into each of the three categories. Left, the classification of all movement-related neurons; middle and right, the classifications of the neurons associated with increased and decreased activity, respectively. The area of each pie chart is proportional to the total number of neurons in the CMAc and SMA; the percentage and actual numbers of neurons in each category are shown next to the corresponding portion of each pie chart. Each category is color coded: red, contralateral neurons; blue, ipsilateral neurons; and gray, bilateral neurons.

