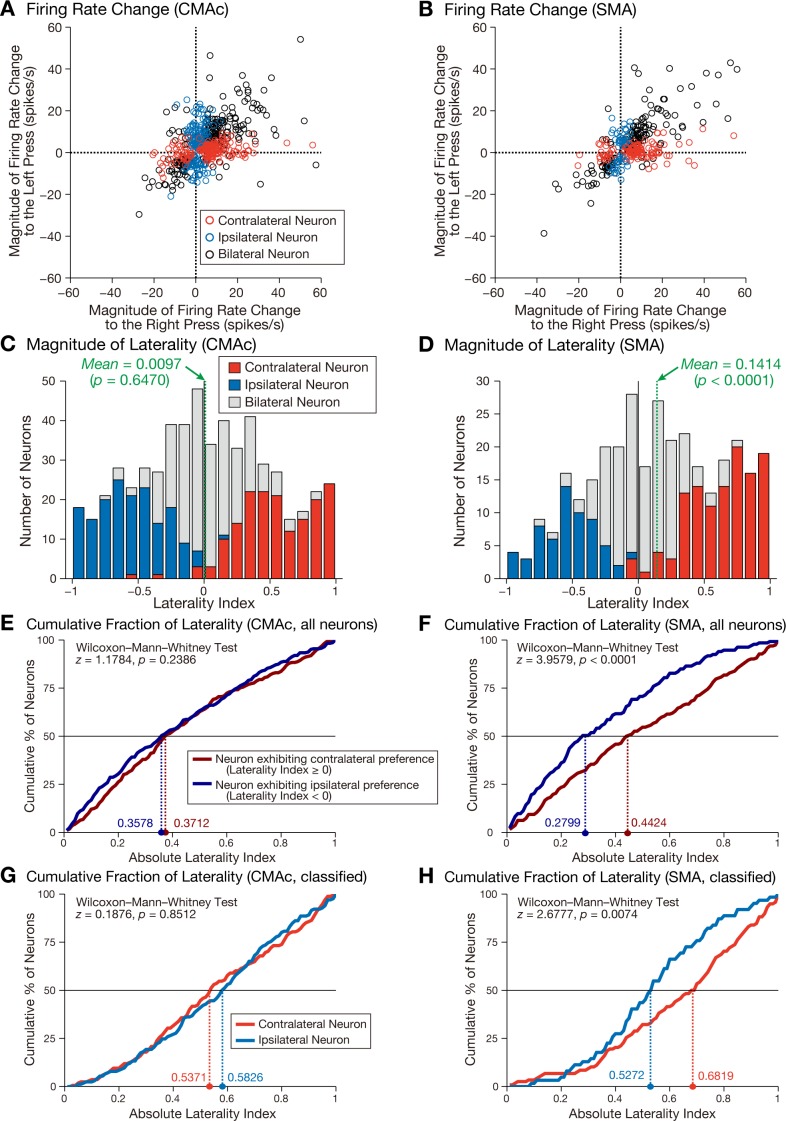
Fig. 5.
Selectivity of neuronal activity for right-press and left-press movements. A and B: relationships of the changes in firing rates between the right-press and left-press trials in the CMAc (A) and SMA (B). The changes in movement-related firing rates from the baseline period for the right-press trials are plotted along the abscissa, and those for the left-press trials are plotted along the ordinate. The positive and negative values denote increased and decreased activity, respectively. Each open circle represents the data of an individual neuron: red, contralateral neuron; blue, ipsilateral neuron; and black, bilateral neuron. Five CMAc neurons (2 contralateral neurons and 3 bilateral neurons) and two SMA neurons (both bilateral neurons) are not shown because they displayed values that were greater than 60 spikes/s for the right-press trials. C and D: distributions of the laterality indexes in the CMAc (C) and SMA (D). The results are compiled into histograms: red, contralateral neurons; blue, ipsilateral neurons; and gray, bilateral neurons. Positive values indicate greater activity for contralateral movement, and negative values indicate greater activity for ipsilateral movement. The green dashed lines indicate the mean values of the laterality index. E and F: cumulative distributions of the absolute values of the laterality indexes for neurons exhibiting contralateral preference (neurons with positive values, dark red) and ipsilateral preference (neurons with negative values, dark blue) in the CMAc (E) and SMA (F). Colored dashed lines indicate the median absolute values for neurons with contralateral preference (dark red) and ipsilateral preference (dark blue). G and H: cumulative distributions of the absolute values of the laterality indexes for contralateral (red) and ipsilateral (blue) neurons, as determined by statistical analysis (paired t-test, P < 0.01) in the CMAc (G) and SMA (H). Colored dashed lines indicate the median absolute values for contralateral neurons (red) and ipsilateral neurons (blue).

