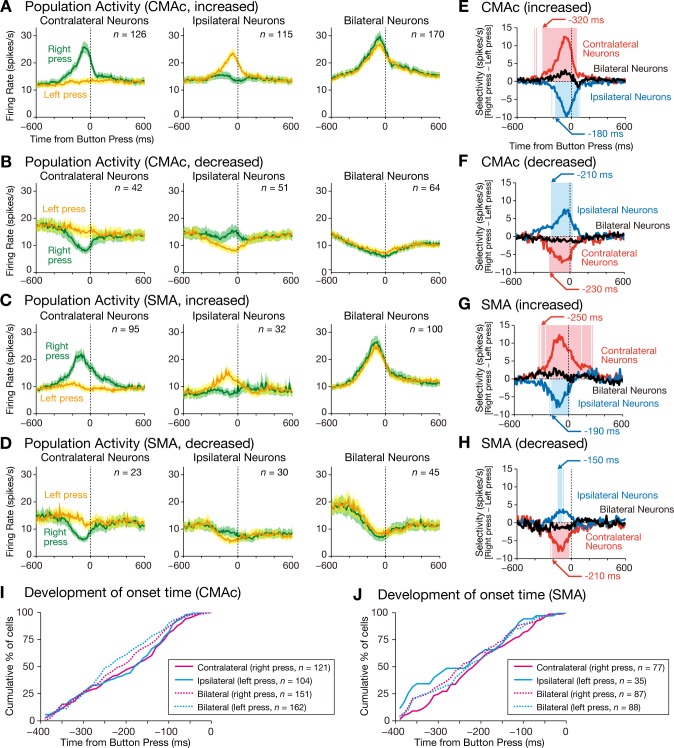
Fig. 6.
Time courses of the population selectivity. A–H: population activities are shown for CMAc neurons exhibiting increased activity (A) and decreased activity (B) and for SMA neurons exhibiting increased activity (C) and decreased activity (D). The mean firing rate (±SE; bin width = 10 ms) is aligned with the button press separately for right-press trials (green) and left-press trials (orange); left, contralateral neurons; middle, ipsilateral neurons; and right, bilateral neurons. Population selectivity is shown for CMAc neurons exhibiting increased activity (E) and decreased activity (F) and for SMA neurons exhibiting increased activity (G) and decreased activity (H). The population selectivity (bin width = 10 ms) was calculated by subtracting activity in the left-press trials from activity in the right-press trials. The selectivity is aligned with the button press; red, contralateral neurons, blue, ipsilateral neurons, and black, bilateral neurons. The red and blue translucent areas indicate 10-ms bins in which selectivity was significantly different from zero for the contralateral and ipsilateral neurons, respectively (1-sample t-test, α = 0.01). Arrows indicate the first of 5 consecutive bins that exhibited significant selectivity. I and J: cumulative distributions of onset time for individual neurons in the CMAc (I) and SMA (J). Magenta solid line, contralateral neurons for right-press trials; cyan solid line, ipsilateral neurons for left-press trials; magenta dashed line, bilateral neurons for right-press trials; cyan dashed line, bilateral neurons for left-press trials.

