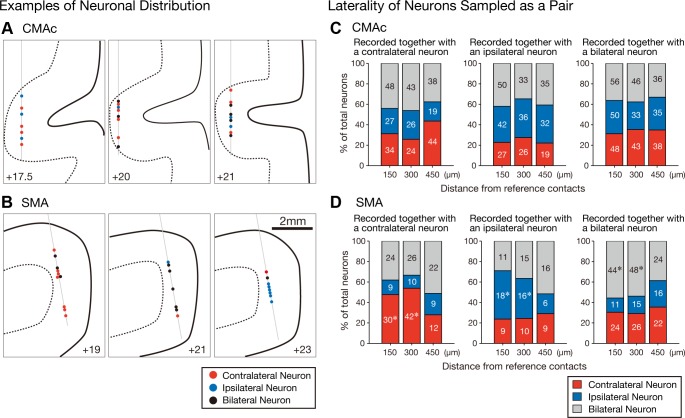
Fig. 7.
A and B: 6 sample recordings from the CMAc (A) and SMA (B). Contralateral (red circles), ipsilateral (blue circles), and bilateral neurons (black circles) are plotted on the coronal sections reconstructed from the magnetic resonance images (solid line, cortical surface; broken line, border between gray matter and white matter). Neurons in each panel were simultaneously recorded with a linear-array multicontact electrode with 24 contacts spaced 150 μm apart. If 2 neurons were simultaneously recorded from 1 contact, 2 circles were plotted side by side. Thin gray thin indicate the electrodes. C and D: distributions of the laterality selectivity of CMAc (C) and SMA (D) neurons that were sampled as pairs of simultaneously recorded neurons (i.e., counterpart neurons) by 2 contacts with reference to a contact containing reference neurons. The stacked bar graphs summarize the distributions of selectivity among the counterpart neurons (150, 300, or 450 μm distant from reference neurons) recorded together with a contralateral-selective reference neuron (left), an ipsilateral-selective reference neuron (middle), or a bilateral-selective reference neuron (right). Each category is color coded as indicated: red, contralateral neurons; blue, ipsilateral neurons; and gray, bilateral neurons. The actual number of neurons in each category is shown within the corresponding portion of each bar graph. The asterisks indicate values that were greater than expected (post hoc residual analysis, P < 0.01).

