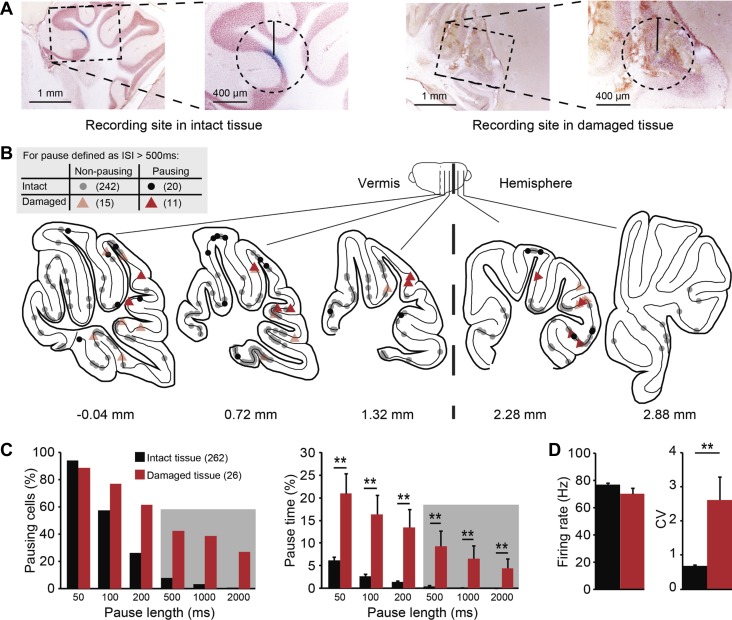
Fig. 2.
Correlating the quality of surrounding tissue with PC SS pauses. A: evaluation of the tissue quality under light microscope. Cells are classified as “intact” if there is no clear tissue damage in a circle with a radius of 400 μm around the injection site (left). If the structure of the surrounding tissue is disrupted, the cell was labeled as “damaged” (right). B: distribution of all cells (n = 288) over the cerebellar cortex, with color indicating the quality of surrounding tissue (black circles, intact; red triangle, damaged) and with the presence (light) or absence (dark) of long SS pauses (>500 ms) indicated by transparency [schematic drawings were adapted from Franklin and Paxinos atlas (Paxinos and Franklin 2001) with permission]. C: histograms comparing pausing cells, indicating the percentage of cells displaying at least one pause of the indicated length, and pause time, indicating the cumulative time of all pauses longer than indicated pause length divided by the total recording time per cell. Note that long pauses (>500 ms) are shaded. PCs recorded from damaged tissue show both higher percentages of pausing cells and pause time for different pause lengths than PCs recorded from the intact tissue (all P < 0.001, Mann-Whitney U-test). D: in line with the increased occurrence of pauses, tissue damage also correlates with higher SS CV, whereas SS firing rate is not affected. No. of cells is indicated in parentheses. Error bars represent SE. **P < 0.01.

