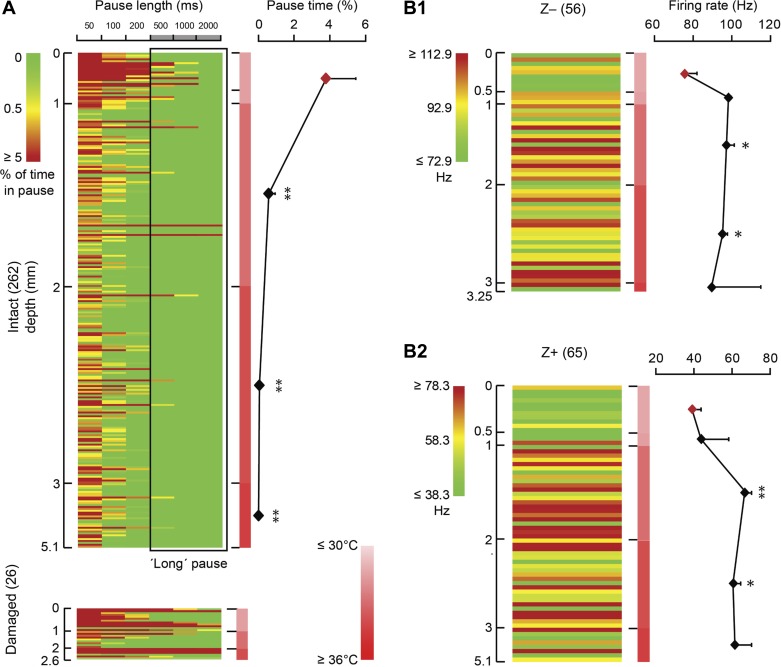
Fig. 3.
The potential influence of temperature on the occurrence of long SS pauses and firing rate. A: in total 262 cells recorded from intact tissue (see Fig. 2B) are presented in a matrix, in which rows represent individual cells ordered based on recording depth, columns represent different pause lengths, and color indicates the percentage of pause time per cell for each pause length. As indicated by the scale bar, the color represents the percentage of the total recording time each cell is pausing, with green indicating no pauses, and dark red indicates that the cell was pausing, at the indicated pause length for 5% of the total recording time or more. The scale bar in the middle indicates the temperature from low (light red) to high (dark red). Note that the maximum temperature (35°C) we detected is lower than the normal mouse body temperature (∼37–38°C), which is presumably an artifact induced by the relatively large temperature probe (diameter ∼200 μm). Recording depth correlates with pausing behavior in that superficial (depth ≤1 mm) PCs in lower temperature have a higher percentage of long pauses than the cells recorded in warmer tissue, at depths deeper than 1 mm (1-way ANOVA followed by Tukey's post hoc test). PCs from damaged tissue are added for comparison (bottom). B1 and B2: lower temperature also correlates with decreased SS firing rate. To eliminate a possible confounding effect, PCs were subdivided based on zebrin identity; both in zebrin-negative (Z−, B1) and zebrin-positive (Z+, B2) PCs the SS firing rate was significantly higher in most deeper regions compared with those at ≤0.5 mm depth (1-way ANOVA followed by Tukey's post hoc test). Row color is determined by the average SS firing rate for Z− and Z+ PCs ± 20 Hz, respectively. No. of cells is indicated in parentheses. Error bars represent SE. *P < 0.05 and **P < 0.01.

