Fig. 4.
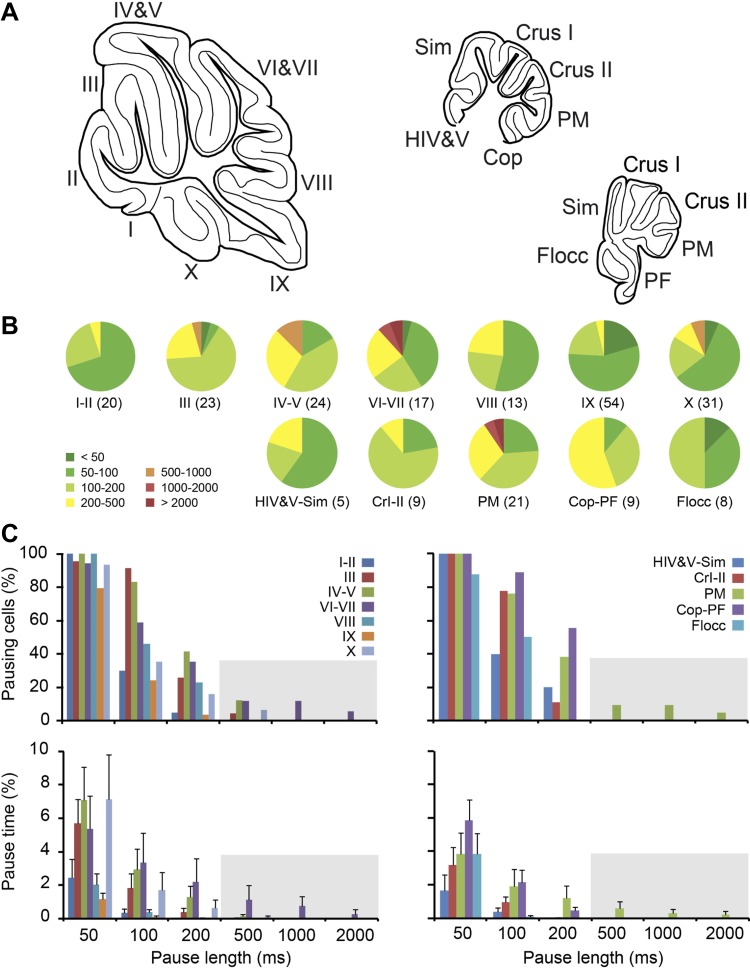
The occurrence of long pauses throughout the cerebellar cortex. Based on the evidence that firing properties can potentially be affected by nonphysiological conditions, we excluded PCs recorded from superficial layers (recording depth ≤1 mm) or damaged tissue. A: schematic drawing of sagittal sections of the vermis and hemisphere (at 2 levels), indicating the lobules and hemispheral regions [schematic drawings were adapted from Franklin and Paxinos atlas (Paxinos and Franklin 2001) with permission]. B: pie charts of the percentages of PCs displaying at least one ISI, or pause length, of the durations indicated by the colors. For example, in lobule III 1 out of 23 PCs (4%) showed at least one ISI of 500-1,000 ms, indicated in orange, and in 1 out of 23 PCs all ISIs were shorter than 50 ms, indicated in dark green. C: top, similar to B, but now displayed per pause length. Bottom, the average pause time compared between different lobules and regions of the vermis and hemisphere for different pause lengths. Whereas long pauses (>500 ms) are rare after imposing the criteria mentioned above, there is little indication of a preferred location of PCs showing shorter SS pauses. Lobules marked by Roman numbers I to X, hemispheral regions are: HIV&V, hemispheric parts of lobules IV and V; Sim, lobus simplex; PM, paramedian lobule; Cop, copula pyramidis; PF, paraflocculus; Flocc, flocculus. No. of cells per area is indicated between brackets.

