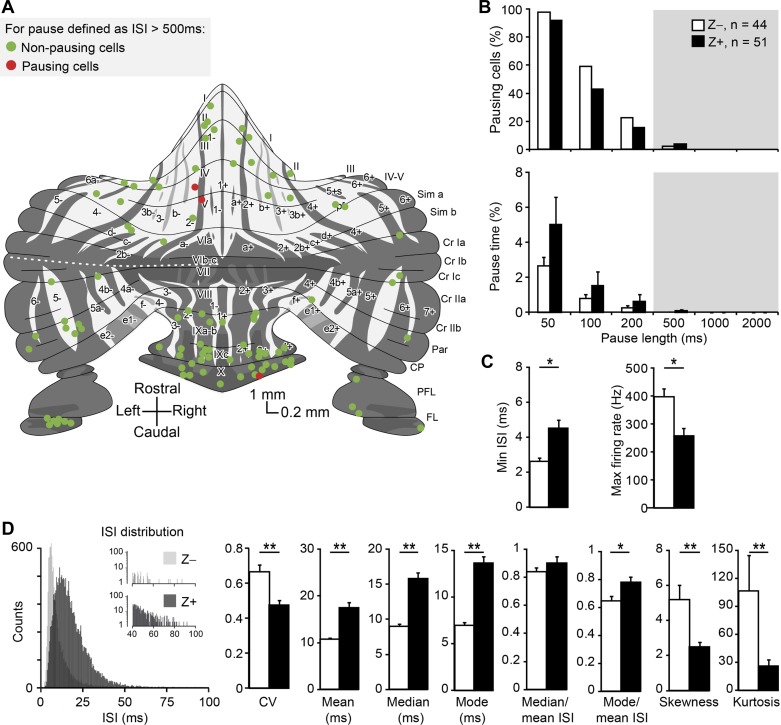
Fig. 5.
SS distribution shape and short pauses correlate with functional modules. A: distribution of PCs of which the zebrin identity and location were determined, throughout the unfolded cerebellum. Note that only 3 out of 95 cells have SS pauses longer than 500 ms. Schematic drawing adapted from Sugihara and Quy (2007) and Zhou et al. (2014). B: the percentages of pausing cells and pause time are not different between Z+ and Z− modules (Z−: n = 44, Z+: n = 51 cells; all P > 0.1, Mann-Whitney U-test). C: Z− cells have shorter minimum ISI and higher maximum firing rate than Z+ cells. D: left, examples of ISI distributions for a Z+ (dark gray) and Z− (light gray) PC. Right, detailed analysis of short SS pauses (<500 ms) based on these ISI distributions revealed differences in most ISI characteristics between Z− and Z+ modules. The differences in median and mode of ISIs are larger than that in mean, suggesting a difference in shape of the ISI distributions. This was confirmed as skewness and kurtosis; the 3rd and the 4th moment describing distributions and measures for asymmetry and “peakedness” that are independent of the mean, respectively, differed between modules. Both kurtosis and skewness are higher in Z− PCs, indicating their ISI distributions have a more preferred ISI combined a larger tail to the right, i.e., more short pauses (50–500 ms). No. of cells is indicated in parentheses. Note that the no. of ISIs in the example distributions is higher for the Z+ PC. Error bars represent SE. *P < 0.05 and **P < 0.01.

