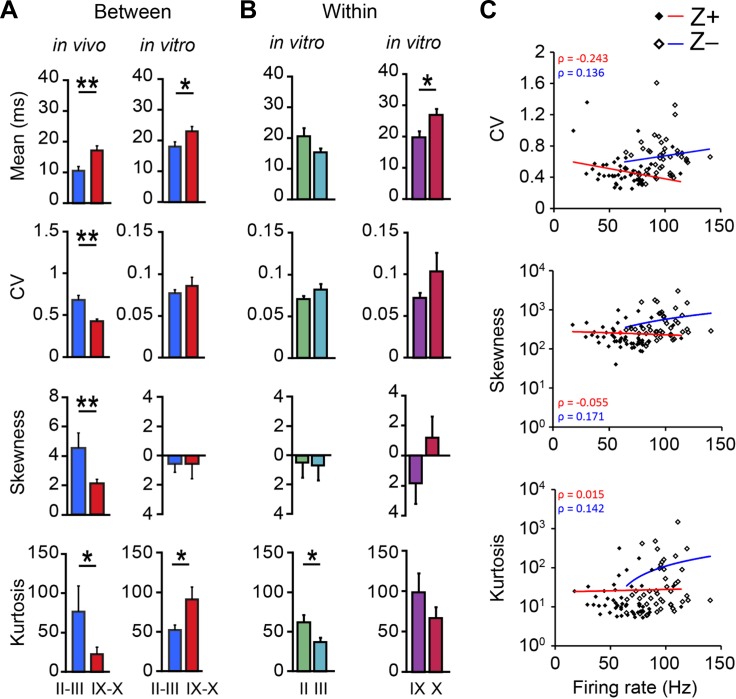
Fig. 7.
Differences in the shape of ISI distributions are absent in vitro. A: to test if the differences in the shape of the ISI distributions are intrinsic to PCs or depend on the input PCs receive, we compared all ISI features of the Z− PCs of lobules II and III with the Z+ PCs of lobules IX and X, recorded in vivo and in vitro (in vivo: n = 16 vs. 35 and in vitro: n = 27 vs. 33 for Z− and Z+ PCs, respectively). In vitro recordings were performed in the presence of blockers for AMPA, NMDA, and GABA, to block synaptic inputs to PCs. As a result, the SS activity only reflects intrinsic activity, which is characterized by a higher mean ISI and skewness and a lower CV and kurtosis. Whereas in vivo, in line with the results of Fig. 5D, the mean, CV, skewness, and kurtosis are all significantly different between Z− and Z+ PCs (P = 0.003, P < 0.001, P = 0.004, and P = 0.038, respectively), in vitro only the difference in the mean ISI persisted (P = 0.027). The other parameters are no longer different, or the difference is even reversed (kurtosis, P = 0.039). B: moreover, the differences we found in vivo between PCs with the same zebrin identity from different lobules, presented in Fig. 6D, are also no longer present in vitro (for II, III, IX, and X, n = 13, 14, 19, and 14, respectively). In the absence of synaptic inputs the differences between Z− PCs of lobules II and III are ablated (skewness, P = 0.87) or even inverted (kurtosis, P = 0.029). Note that for PCs recorded in vitro zebrin identity was not confirmed. C: whereas the difference between Z− and Z+ PCs was found to be largely dependent on differences in intrinsic activity, the differences in shape of the ISI distribution are absent in vitro. This implicates that firing rate and ISI distribution should be independent factors, and thus not correlate with each other. To evaluate this, we plotted these parameters against each other and determined the correlation coefficients, for in vivo recorded Z− and Z+ PCs. Indeed, we found no significant correlations in any of the plots (with and without log-linear transformations, all P > 0.05, Spearman's correlation). Error bars represent SE. *P < 0.05 and **P < 0.01.

