Fig. 2.
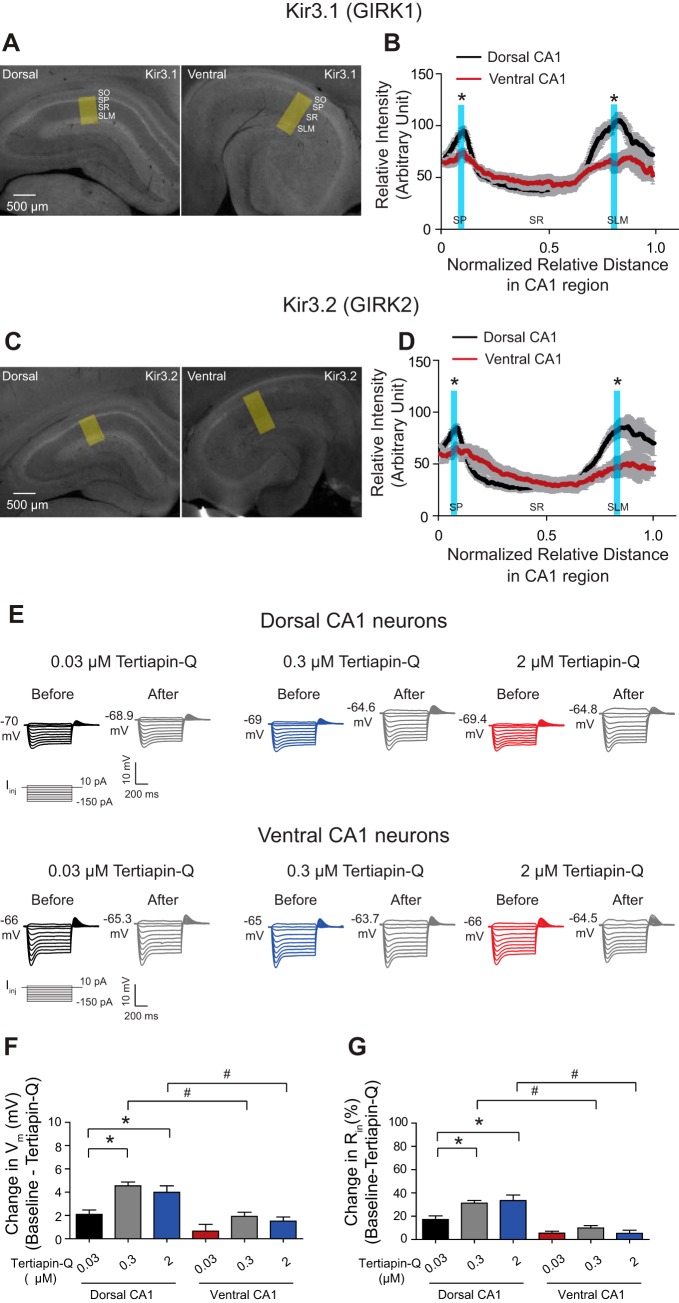
Dorsal CA1 neurons show a more basal G-protein-coupled inwardly rectifying potassium (GIRK) activity than ventral CA1 neurons. A and C: representative dorsal and ventral hippocampal slices immunolabeled with antibodies against IRK channel (Kir)3.1 (A; GIRK1) and Kir3.2 (C; GIRK2). Yellow boxes depict the region of the slice used for quantification of signal intensity (B and D). Quantification of Kir3.1 (B) and Kir3.2 (D) protein expression from the perisomatic region to the distal dendritic region of CA1 from the dorsal and ventral hippocampus. The protein expression of Kir3.1 (B) and Kir3.2 (D) was increased significantly in the somatic and distal dendritic regions of CA1 from the dorsal hippocampus compared with the ventral hippocampus. Vertical blue bars highlight part of the CA1 radial axis that shows significant differences in Kir3.1 (B) and Kir3.2 (D) protein expression between the dorsal and ventral CA1 region. E: representative voltage responses with step current commands at RMP. F and G: Tertiapin-Q (0.3 μM) significantly changed Vm and Rin in dorsal but not ventral neurons. Tertiapin-Q (2 μM) produced similar effects on Vm and Rin compared with 0.3 μM Tertiapin-Q wash-in in dorsal and ventral neurons. Dorsal CA1 neurons showed significant changes in Vm and Rin in the presence of 0.3 or 2 μM Tertiapin-Q compared with ventral CA1 neurons. *P < 0.05; #P < 0.05 vs. ventral group. SO, stratum oriens; SP, stratum pyramidale; SR, stratum radiatum; SLM, stratum lacunosum moleculare.

