Fig. 3.
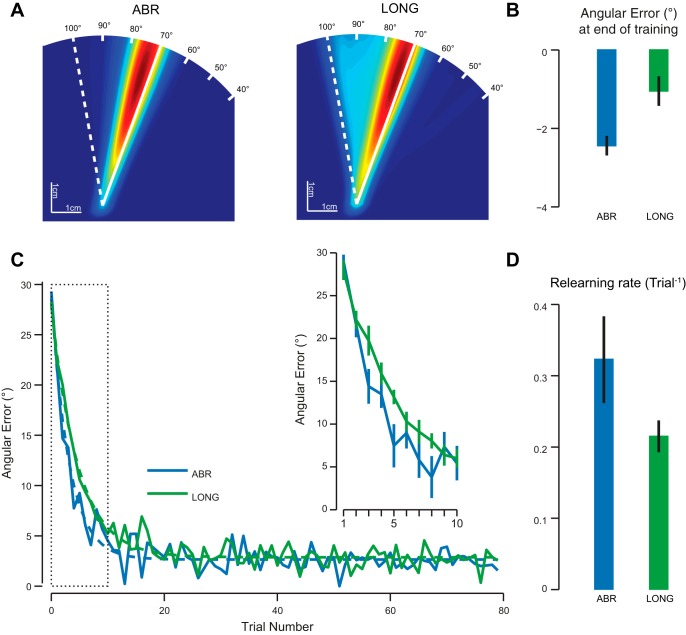
Comparison of the abrupt (ABR) and long (LONG) groups during the training and savings periods. A: heat maps representing the hand movement direction experienced during the training period. Each heat map is normalized separately. Blue colors are associated with directions that are barely followed, while red colors correspond to frequently used directions. Solid and dashed white lines represent the ideal cursor and hand directions under the full visuomotor rotation, respectively. B: angular error of the cursor with respect to the target at the end of the training period (average over last 10 trials). Error bars are SE. C: evolution of the angular error during the relearning period. Solid lines represent the intersubject average for each group. Dashed lines represent the exponential fit to those data. Inset illustrates the evolution of the angular error for the first 10 trials. Error bars are SE. D: rate of relearning for each group. Error bars are SE of the mean obtained by bootstrap.

