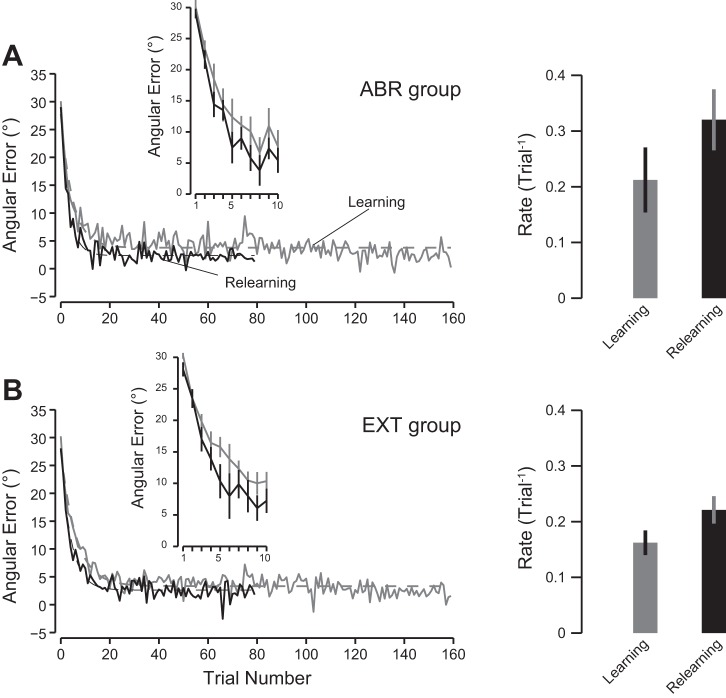
Fig. 4.
Evolution of the angular error (°) between the cursor and the target over the course of trials during the training and relearning periods (gray and black traces, respectively) for the ABR group (A) and for the EXT group (B). Solid lines represent the intersubject average for each period (training and relearning). Dashed lines represent the exponential fit to the data. Inset illustrates the evolution of the angular error for the first 10 trials. Error bars are SE. Right: rate of learning and relearning for each group. Error bars are SE of the mean obtained by bootstrap.

