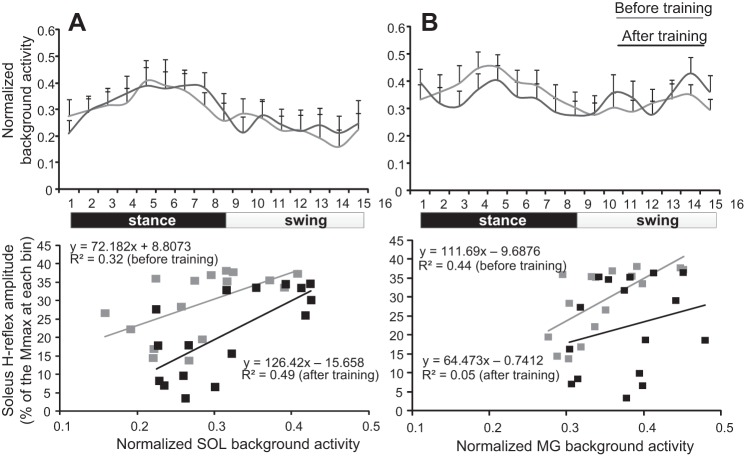
Fig. 8.
Relationship between conditioned soleus H reflex and background EMG activity. A: normalized soleus background EMG activity (top) along with the mean normalized soleus background EMG activity plotted against the conditioned soleus H reflex for each bin of the step cycle (bottom) before and after locomotor training. B: normalized MG background EMG activity (top) along with the mean normalized MG background EMG activity plotted against the conditioned soleus H reflex for each bin of the step cycle (bottom) before and after locomotor training. For both graphs at the bottom, the 16 points correspond to the 16 bins of the step cycle.

