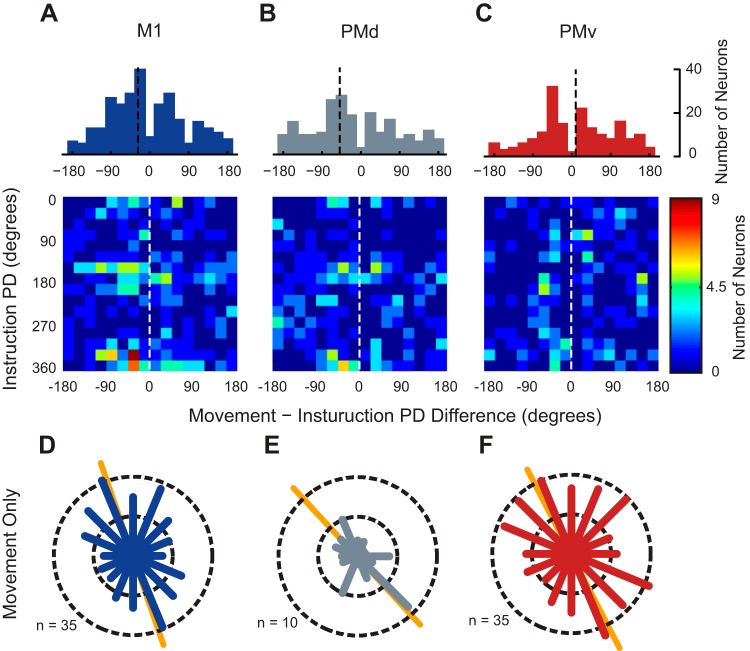
Fig. 5.
Changes in orientation of PD distributions are due to two populations of neurons. A–C, top: 1-dimensional histograms showing the difference between PDs calculated during INS and MOVE. Black dashed lines indicate the median PD of the population. A–C, bottom: 2-dimensional histograms showing the differences between the PDs calculated during the INS and MOVE epochs with respect to their PD in the INS period. Dashed white lines indicate a PD change of 0°. For a cell to be included in these analyses it had to be significantly tuned in both epochs. D–F: pooled distributions of preferred directions for neurons tuned only in the movement epoch. Conventions are the same as Fig. 4.

