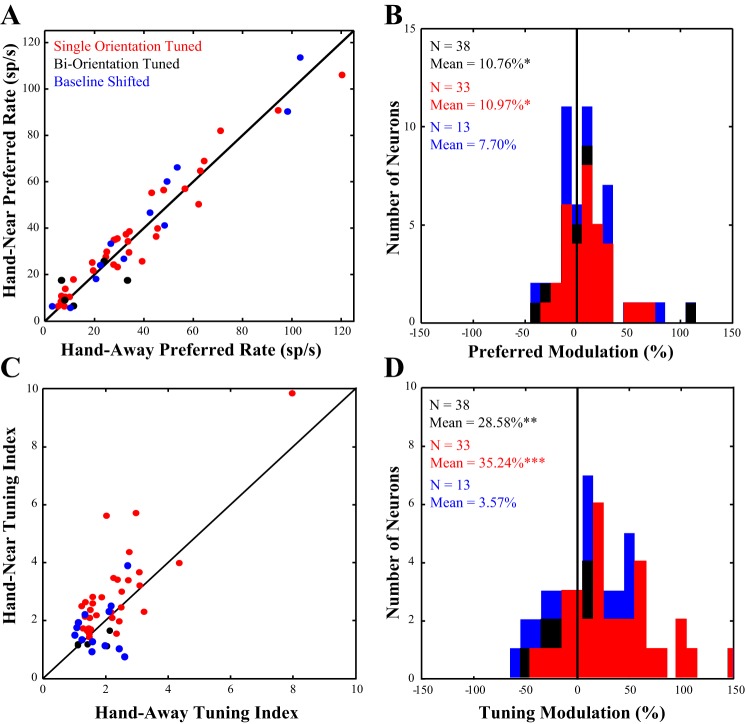
Fig. 3.
Modulation of preferred rate and tuning. A: the response of each neuron to the preferred orientation in the Hand-Away (x-axis) condition is plotted against the response of each neuron in the Hand-Near (y-axis) condition. The diagonal line on the plot represents the line of unity; the majority of points fall above this line, indicating an increased response to the preferred orientation when the hand was nearby. B: we quantified this change in response by computing a modulation index and found that the presence of the hand significantly increased neuronal response to the preferred orientation (seen as a shift of the population to the right of zero). C: the tuning index of each neuron in the Hand-Away condition (x-axis) is plotted against the tuning index in the Hand-Near condition (y-axis). Again more units fall above the line of unity. D: we used the same modulation index to quantify tuning modulation and found that the presence of the hand significantly sharpened tuning. Data in red represent all neurons in the dataset that were tuned for a single orientation. Data in black represent neurons that were tuned for two orientations, and data in blue are neurons that were excluded from the main analysis, as they showed a significant baseline shift between the Hand-Near and Hand-Away conditions.

