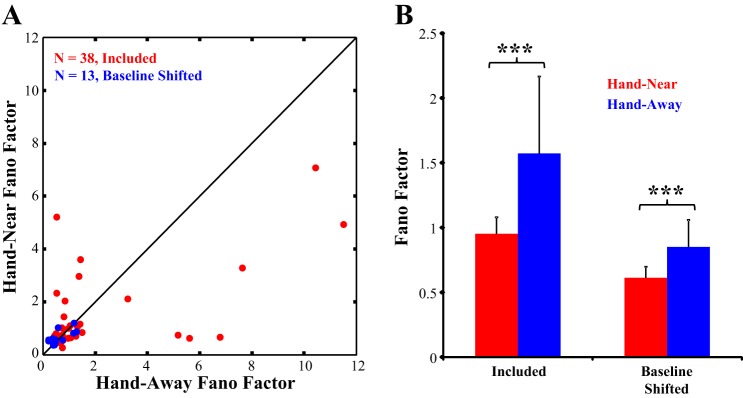
Fig. 5.
Changes in response variability. A: the Fano factor in the Hand-Near and Hand-Away conditions are plotted for the population of neurons included in the dataset (n = 38, in red) and baseline shifted neurons (n = 13, in blue). B: in both populations, response variability was significantly reduced when the hand was present. ***Significant difference, Hand-Near vs. Hand-Away.

