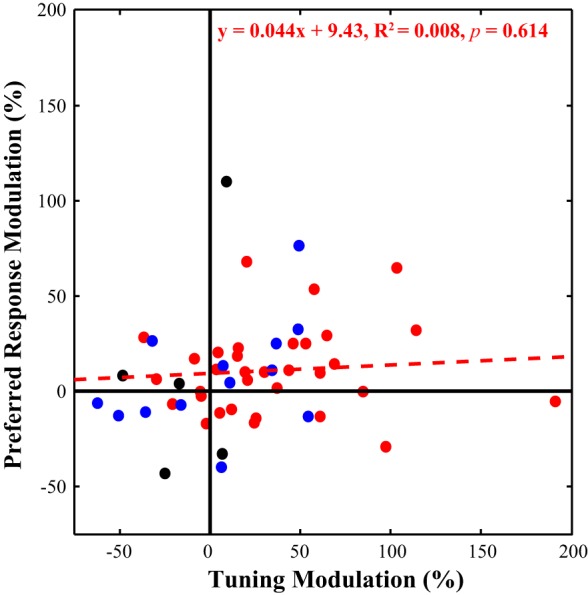
Fig. 6.

Response modulation vs. sharpened tuning. We plotted the tuning modulation (x-axis) against the preferred modulation (y-axis) for each unit. While the majority of the neurons fall within the top right quadrant, the population of single orientation tuned neurons (in red) did not show a significant relationship between modulation in the preferred response and changes in the tuning index. Biorientation neurons are shown in black, and baseline shifted neurons in blue for comparison.
