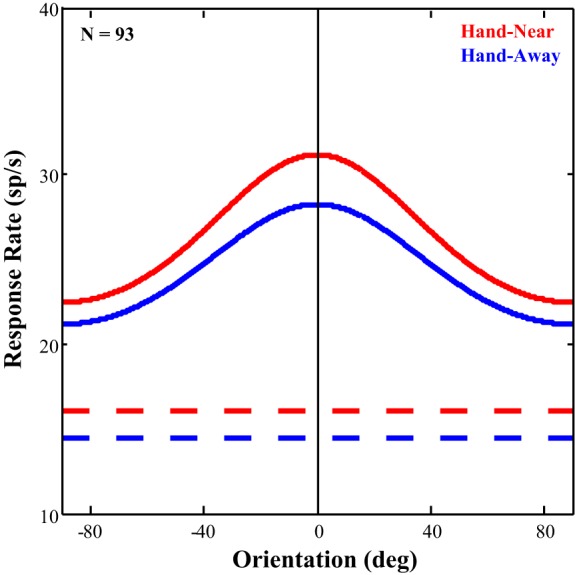
Fig. 8.

Effect of hand position across the full population. All neurons, regardless of responsivity, were aligned to the orientation of their maximum response, averaged with each hand condition and then fit with von Mises functions. The curve fits and baseline rates are depicted for qualitative comparison. Curve amplitude did not differ appreciably between conditions (Hand-Near = 9.84, Hand-Away = 9.66). There was, however, a qualitative sharpening of tuning which showed an almost 20% increase in the Near-Hand condition (0.429) over that in the Hand-Away (0.359) condition.
