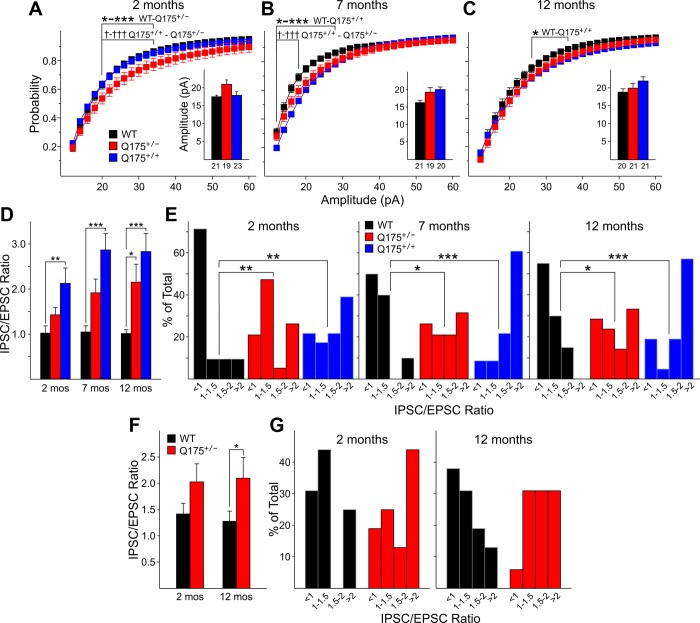
Fig. 4.
A–C: cumulative amplitude histograms for sIPSCs from WT, Q175+/−, and Q175+/+ mice at 2 (A), 7 (B), and 12 (C) mo. The proportionate distribution of larger amplitudes was significantly greater at 2 mo in Q175+/− compared with either WTs or Q175+/− mice, as shown by the distributional shift to the right. Similarly at 7 and 12 mo, distributions of events for either Q175+/− or Q175+/+ mice also were shifted to the right. The average amplitudes of sIPSCs (insets) from Q175+/− or Q175+/+ mice also were increased compared with WTs, but these increases were not statistically significant. D: average sIPSC-to-sEPSC ratios for MSNs were significantly increased for Q175+/+ compared with those from WT mice at all ages. The average ratio was significantly increased for Q175+/− compared with those from WT at 12 mo. E: normalized distributions of sIPSC-to-sEPSC frequency ratios for all MSNs in each age group [divided into 4 categorical bins: <1 (fewer sIPSCs than sEPSCs), 1–1.5 (more sIPSCs than sEPSCs), 1.5–2.0, and >2.0]. For all 3 ages these distributions were significantly shifted to the right for Q175+/− or Q175+/+ compared with WT mice, indicating that proportionately more neurons had higher ratios of sIPSCs to sEPSCs. F: average sIPSC-to-sEPSC ratios for CPN were increased for Q175+/− compared with those from WT mice at both 2 and 12 mo, but the difference only was significant at 12 mo. G: normalized distributions of sIPSC-to-sEPSC frequency ratios for all MSNs in each age group (similar to E). For both ages the distribution shifted proportionately to the greater ratios.

