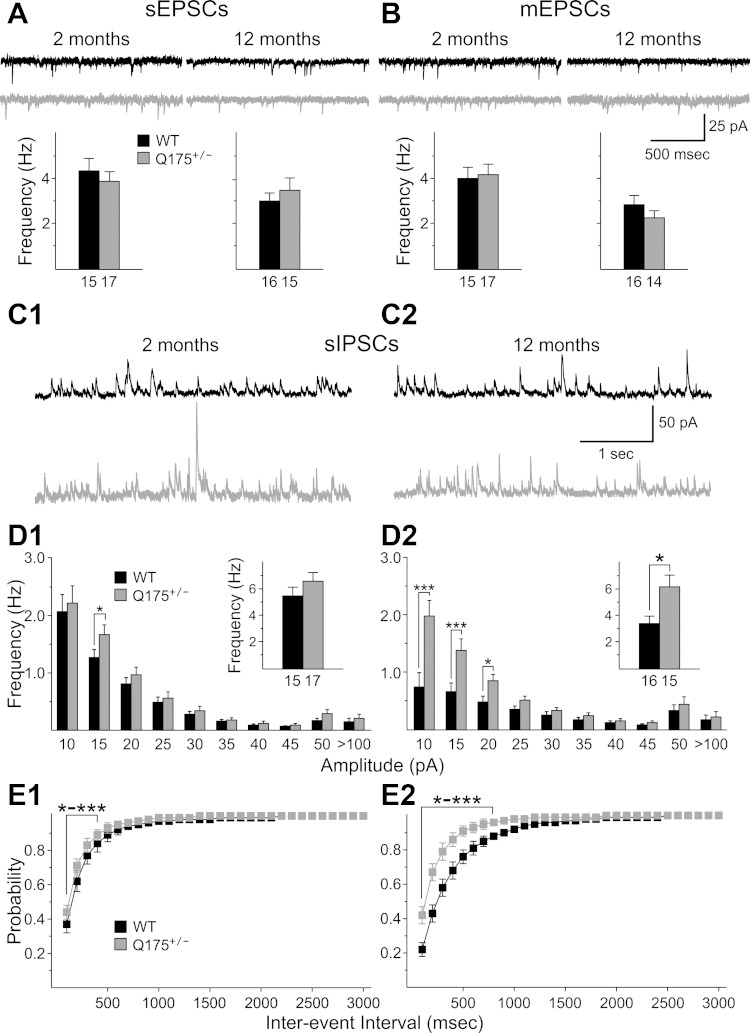
Fig. 7.
A and B: representative traces of sEPSCs (A) and mEPSCs (B) from CPNs at 2 and 12 mo for WT and Q175+/− mice at a VHold of −70 mV. Bar graphs below each set of traces show the average frequencies of sEPSCs and mEPSCs at each age for each group. There were no significant changes between groups at each age. C: representative traces of sIPSCs recorded from CPNs at a VHold of +10 mV at 2 (C1) and 12 (C2) mo. D: amplitude-frequency histograms for WT and Q175+/− and Q175+/+ mice at 2 (D1) and 12 (D2) mo. Significant increases in frequency occurred for the 10–15 pA bin for Q175+/− mice compared with WTs at 2 mo. At 12 mo significant increases occurred for comparisons between Q175+/− and WT mice for 10–20 pA bins. The average frequency of sIPSCs (insets) was increased significantly for Q175+/− mice at 12 mo. E: cumulative interevent interval histograms for Q175+/− and WT mice at 2 (E1) and 12 (E2) mo. Histograms were significantly shifted to the left for Q175+/− compared with WT at both ages.

