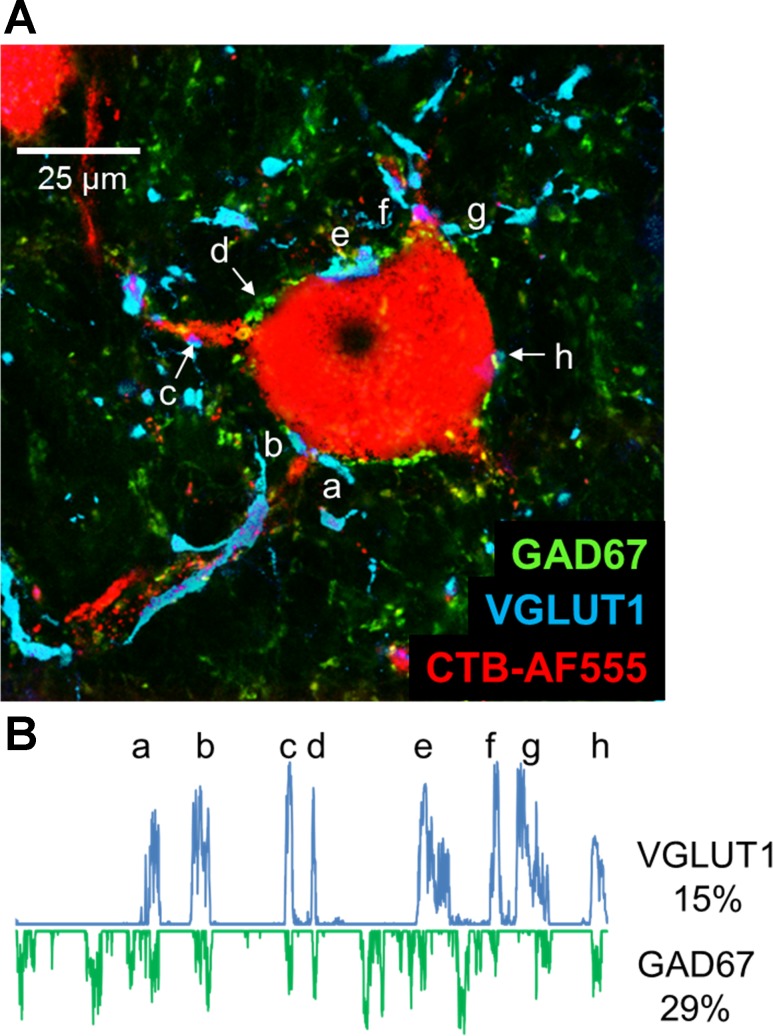
Fig. 1.
A: a single confocal image of a retrogradely labeled motoneuron (red), taken from a histological section of the spinal cord of an intact rat, is shown to demonstrate the methods used. The section was reacted with antibodies for the demonstration of the synapse-associated proteins, VGLUT1 (cyan) and GAD67 (green). A region of interest (ROI) was created around the perimeter of the cell, using the threshold function of ImageJ and only the red channel of the image. From this ROI, profile plots were generated to measure the fluorescence intensity along a 1-μm-wide line about the cell perimeter. B: profile plots for the cell in A are shown for immunoreactivity to VGLUT1 (positive values) and for the exact same locations for GAD67 (negative values). Lowercase letters a–h indicate places on the profile plot for VGLUT1 and their corresponding locations in the image in A. In this cell, 15% of the perimeter of the cell was in contact with VGLUT1-IR structures, and 29% was contacted by GAD67-IR structures.

