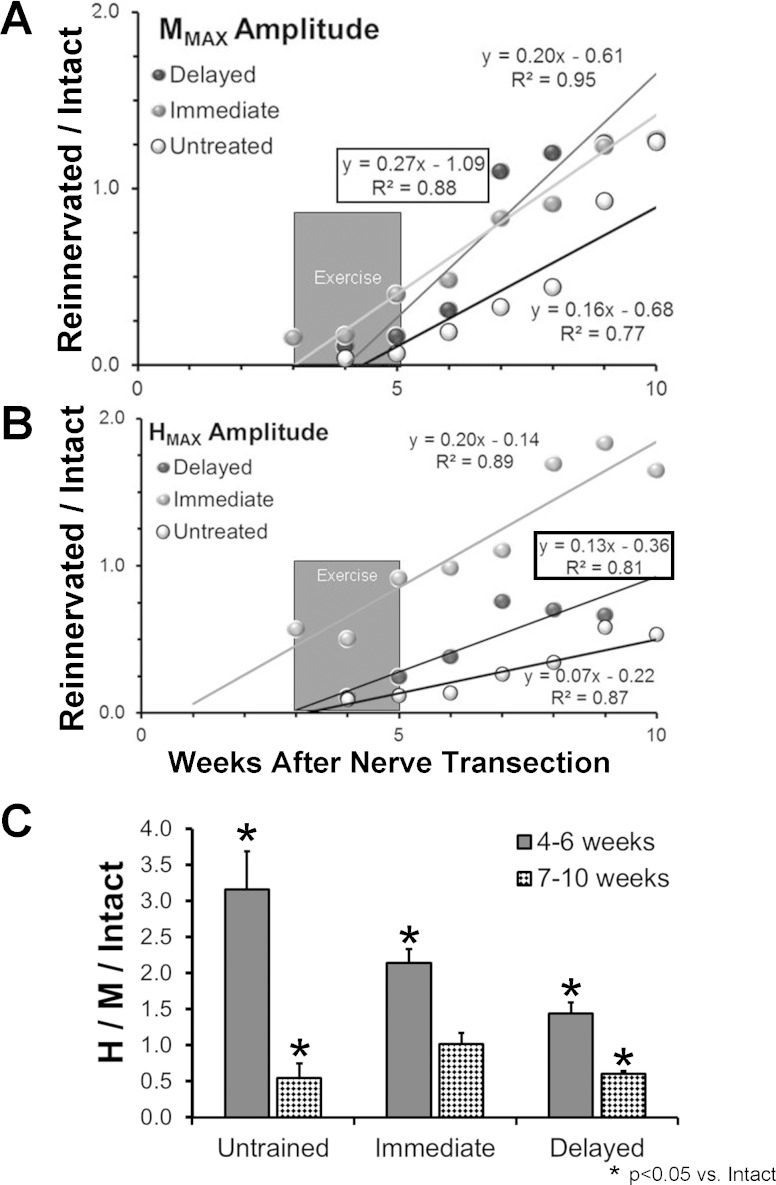
Fig. 2.
EMG activity from the soleus muscle of the right hindlimb was evoked by tibial nerve stimulation before and at different times after transection and surgical repair of the sciatic nerve in 3 groups of rats: Untreated; rats exercised for 2 wk beginning 3 days after nerve transection (Immediate); and rats exercised for 2 wk beginning at the first sign of muscle reinnervation (mean ± SD: 22.25 ± 6.02 days) after nerve repair (Delayed). At each time studied, data were collected separately at stimulus intensities evoking the maximal direct muscle (M) response and maximal H reflex. A: changes in the amplitude of the M response, scaled to the M response amplitude encountered prior to nerve transection and repair, as a function of recovery time for the 3 groups of rats. Each symbol represents the average of 6 (Untreated or Immediate) or 4 (Delayed) rats. Data were fit with a least-squares linear regression line, and the formula for the line and the correlation coefficient are shown next to each regression line. Regression equations and correlation coefficients for the Delayed group are enclosed in boxes. The darkly shaded box marks the approximate time of exercise in the Delayed exercise group. B: data for the maximal H reflex are shown in a format similar to A. C: mean scaled Hmax/Mmax ratio (±95% confidence limits) over the periods of 4–6 wk and 7–10 wk post-nerve transection and repair are shown for each of the 3 groups studied.

