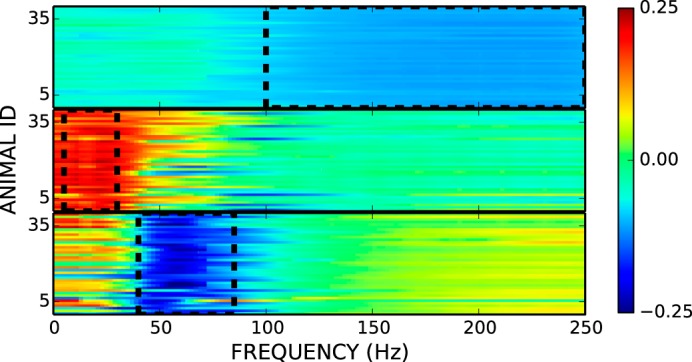
Fig. 1.

Principal component (PC) analysis of electrocorticographic (ECoG) spectral power for all rats. The first three components were consistent across the 40 rats (y-axis). The weights for these first three components from 1 to 250 Hz (2-Hz resolution) are shown in arbitrary units ranging from −0.25 to +0.25. Bandwidths used for μβ (PC2; middle), γ1 (PC3; bottom), and γ2 (PC1; top) are outlined in black dashed lines.
