
Fig. 3.
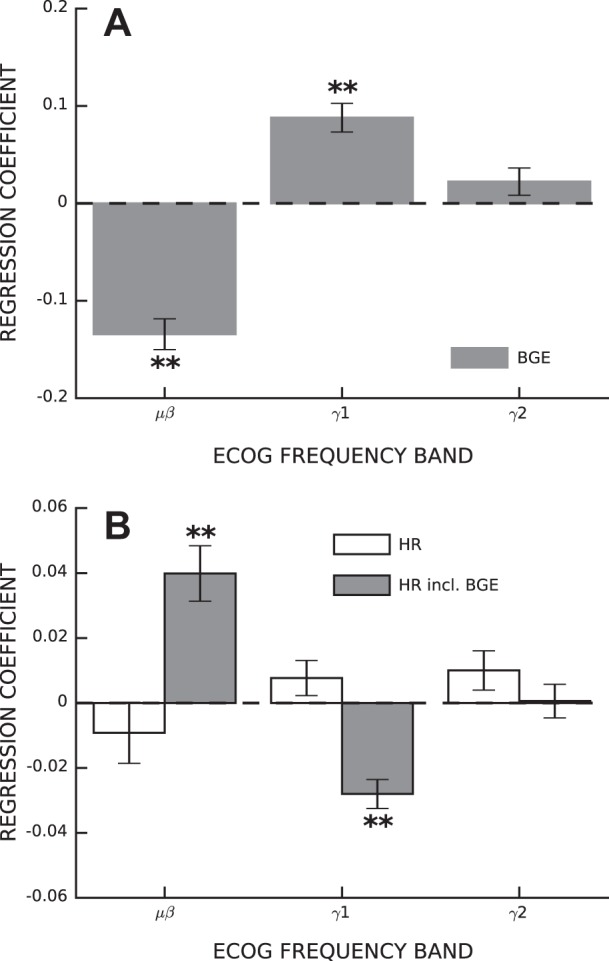
ECoG activity correlates with BGE and HR size. A: average regression coefficients between ECoG band power and BGE (±SE). B: average regression coefficients between ECoG band power and the H-reflex with (solid bars) and without (open bars) BGE included in the list of independent variables. *P < 0.05; **P < 0.001.