
Fig. 4.
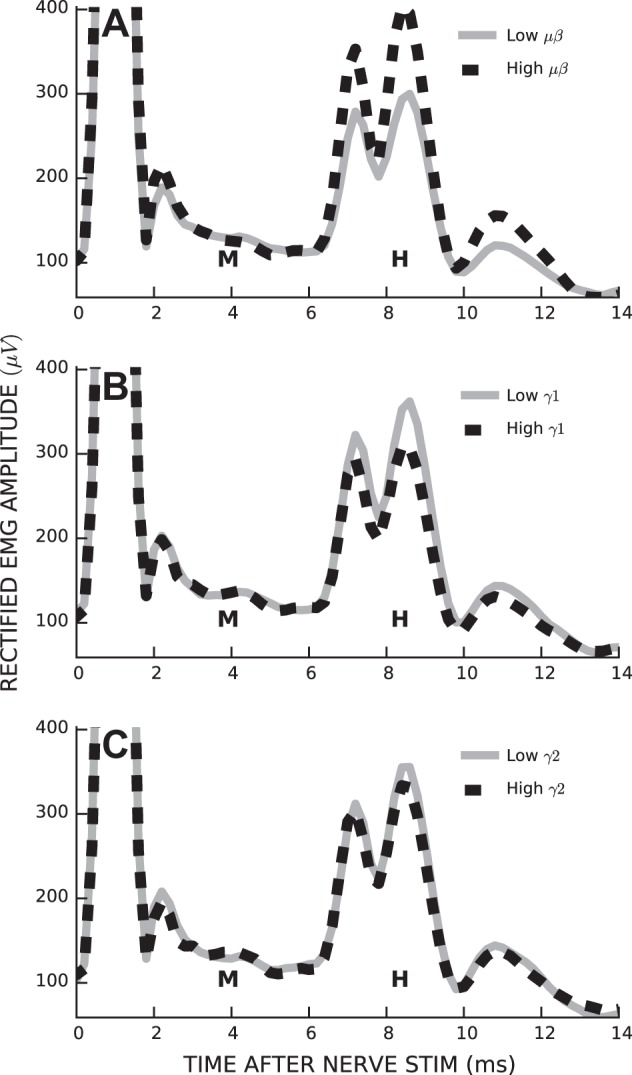
Stimulus-evoked soleus EMG activity from a representative rat under conditions of low (solid line) and high (dashed line) ECoG band power in μβ (A), γ1 (B), and γ2 (C) bands. M, M-wave; H, H-reflex.
Official websites use .gov
A
.gov website belongs to an official
government organization in the United States.
Secure .gov websites use HTTPS
A lock (
) or https:// means you've safely
connected to the .gov website. Share sensitive
information only on official, secure websites.
Stimulus-evoked soleus EMG activity from a representative rat under conditions of low (solid line) and high (dashed line) ECoG band power in μβ (A), γ1 (B), and γ2 (C) bands. M, M-wave; H, H-reflex.