
Fig. 3.
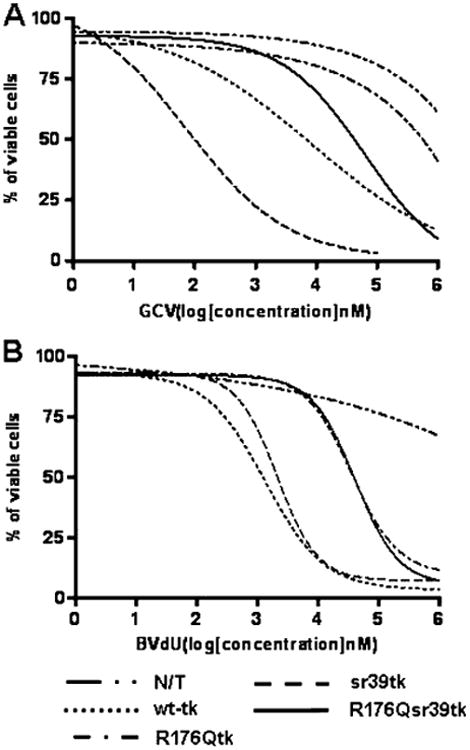
Assessment of drug sensitivity of non-transduced (N/T) and transduced U87 cells to GCV (a) and BVdU (b) nucleoside analogs in vitro. HSV1-sr39tk+ cells showed the lowest IC50 for GCV (0.10 μM). IC50 values for wild-type HSV1-tk, HSV1-R176Qtk, and HSV1-R176Qsr39tk expressing cells with GCV were 10, 940, and 111 μM, respectively. The IC50 for non-transduced cells with GCV was >1 mM. IC50 values for wild-type HSV1-tk, HSV1-sr39tk, HSV1-R176Qtk, and HSV1-R176Qsr39tk expressing cells with BVdU were 1.3, 2.1, 91, and 92 μM, respectively. The IC50 for non-transduced cells with BVdU was >10 mM. N/T non-transduced cells. Representation of three independent experiments