
Fig. 4.
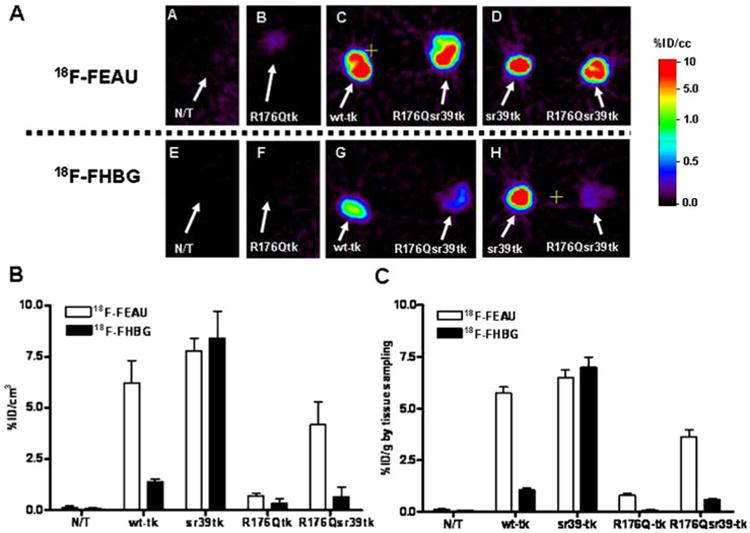
MicroPET imaging of reporter gene expression. A Axial microPET images through the xenografts placed s.c. over the shoulders are shown: a, e non-transduced (N/T) and transduced U87 xenografts, including HSV1-R176Qtk (b, f) and wild-type HSV1-tk (c, g left), HSV1-sr39tk (d, h left), and HSV1-R176Qsr39tk (c, d, g, h right). 18F-FEAU (upper row) and 18F-FHBG (lower row) images at 2 h after radiotracer administration are shown for the same animal obtained on consecutive days. All images were adjusted to the same color scale. B Image-based measurements of 18F-FEAU and 18F-FHBG at 2 h after radiotracer administration in the same animals expressed as % injected dose/cc of tissue (%ID/cc, n=5). Values are the mean±SD. C Tissue sampling-based measurements of 18F-FEAU and 18F-FHBG accumulation at 2 h after radiotracer administration. Expressed as % injected dose/gram of tissue (%ID/g, n=5). Values are the mean±SD