
Fig. 5.
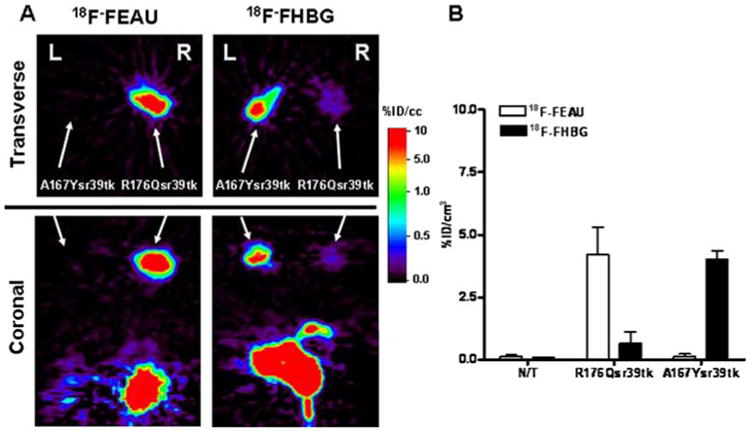
MicroPET imaging comparison of HSV1-R176Qsr39tk and HSV1-A167Ysr39tk reporter gene expression in the same animal. a A representative animal bearing a HSV1-R176Qsr39tk- (right shoulder) and a HSV1-A167Ysr39tk- (left shoulder) expressing xenograft was imaged with 18F-FEAU and 18F-FHBG on 2 consecutive days. Axial (transverse) and coronal sections through the tumors are shown. All images were adjusted to the same color scale. High specific 18F-FEAU accumulation was observed in the HSV1-R176Qsr39tk+ xenograft and high specific accumulation of 18F-FHBG was observed in theHSV1-A167Ysr39tk xenograft. Slight 18F-FHBG accumulation was also observed in HSV1-R176Qsr39tk-expressing xenograft. Note radiotracer clearance from gut and bladder. b Image-based measurements of 18F-FEAU and 18F-FHBG at 2 h after radiotracer administration expressed as % injected dose/cc of tissue (%ID/cc, n=5). Values are the mean±SD. N/T non-transduced