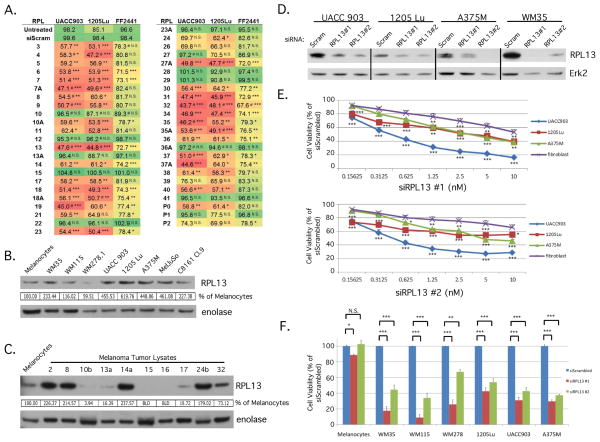
Figure 1. siRNA targeting of ribosomal proteins in the large subunit decreased melanoma cell viability.
(A) A screen containing three independent siRNA targeting each RPL was transfected into 1205 Lu, UACC 903, or FF2441 cells. Cell viability was measured by a MTS assay and values were averaged for each RPL. The heatmap colors visually depict effect of respective RPL knockdown on cell viability. Green = least effect on cell viability. Red = largest effect on cell viability. # indicates instances where 2 of 3 siRNA displayed the growth effect instead of 3 of 3. * p<0.05, ** p<0.01, ***p<0.001. (B) Western blot comparing RPL13 protein levels between FOM103 melanocytes and melanoma cell lines. Protein band intensity was quantified using ImageJ software and RPL13 values normalized to the alpha enolase control and expressed as a percentage of FOM103 control. (C) Western blot comparing RPL13 protein levels between FOM103 melanocytes and melanoma tumor lysates. Blot intensities were quantitated using ImageJ software, normalized to alpha enolase loading control and expressed as a percentage of FOM103 control. BLD = below level of detection. (D) siRNA to RPL13 or scrambled control were transfected into UACC 903, 1205 Lu, A375M, and WM35 cells to demonstrate the ability of each siRNA to knockdown RPL13 protein expression. Erk2 was used as a control for equal protein loading. (E,F) siRNA to RPL13 or scrambled control were reverse transfected into fibroblast and melanoma cell lines at varying concentrations (E) or at 10 nM (F) and cell viability measured by MTS to compare differences in extent of cell viability decrease. Fibroblasts represent the average of four different fibroblast cell lines; MRC5, FF2441, and two primary neonatal fibroblast cell lines (Neonatal Fibroblasts, and FibroNeoSkin). * p<0.05, ** p<0.01, ***p<0.001. (N≥3) Bars; average, ±SEM.

