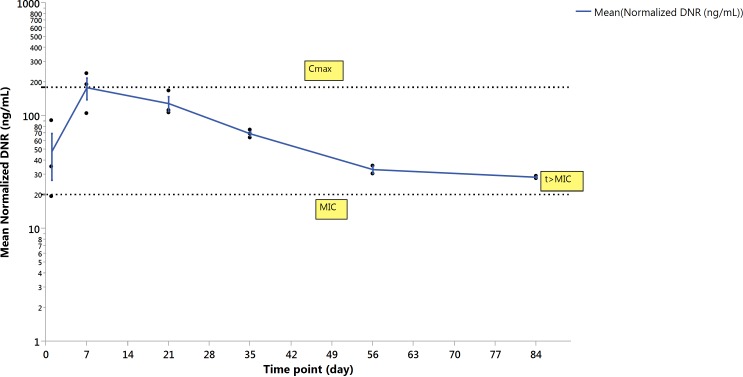
Figure 2.
Daunorubicin concentration detected by LC-MS/MS in the vitreous supernatant over time. t > MIC indicates DNR concentration in vitreous stayed above the MIC for at least 84 days (observed) and the predicted t > MIC was longer. Each error bar is constructed by using one standard error from the mean. Cmax, maximum concentration detected; MIC, minimum inhibitory concentration; t, time (days).

