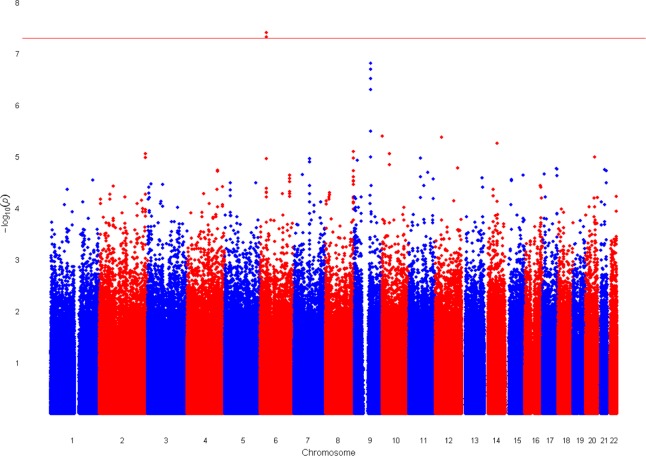
Figure 1.
Manhattan plot of the GWAS for steroid-induced OH. The Manhattan plot depicts the genome-wide P values. The results for the total of 1,545,328 genotyped SNPs that passed the quality control criteria are plotted as −log10(P value) by genomic position. The red line indicates the genome-wide significance level of P = 5 × 10⁻⁸.

