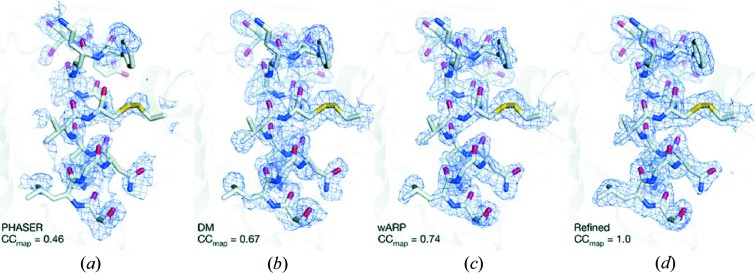
Figure 3.

Electron density maps are shown. (a) Single-wavelength anomalous dispersion (SAD) phasing using the PHASER software (McCoy et al., 2007 ▶). (b) Solvent flattening with the DM software package (Cowtan, 1994 ▶). (c) Automatic building using wARP (Langer et al., 2008 ▶). (d) Final map after refinement. The correlation between the respective maps and the final, refined  electron density d is indicated. All maps are contoured at 1.0σ. [Reprinted by permission from Macmillan Publishers Ltd: Barends et al. (2014 ▶), Nature (London), 505, 244–247, copyright (2014).]
