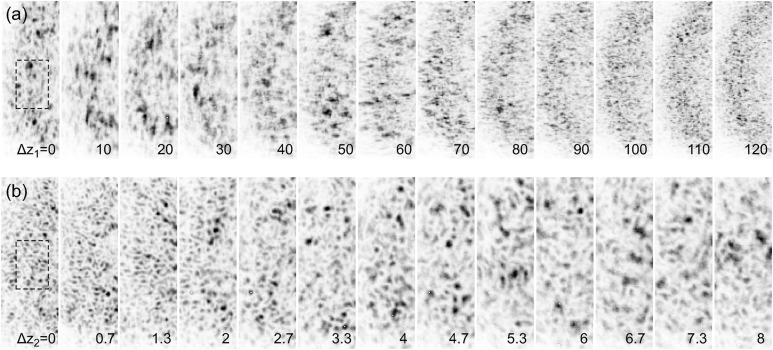
Figure 2.
(a) Speckle patterns measured at different lens positions  for the single CRL set configuration. (b) Speckle patterns measured at different lens positions
  for the double CRL set configuration, with the position of the primary lens remained fixed at
  = 4 m. The shown portions of the scattering patterns are centered around
  = 0.05 nm−1. All patterns are 120 shot (1 s) averages. Lens positions are indicated at the lower right-hand corners of each pattern in millimeters. The dashed rectangle in both
  = 0 images indicates the region of interest used for subsequent speckle size analysis.

