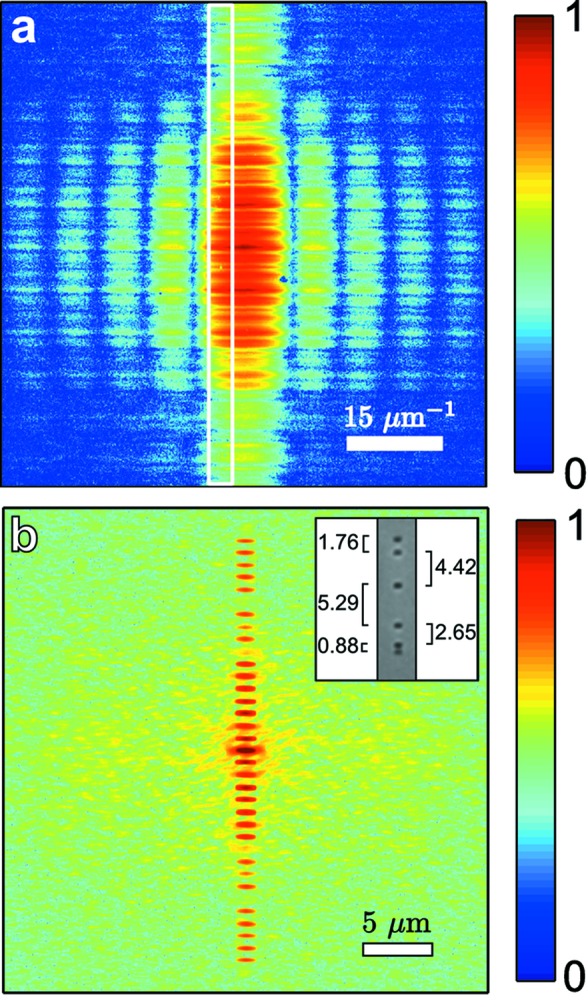
Figure 2.

(a) Diffraction pattern from a vertically oriented NRA measured at 500 eV and  = 100 µm. The white rectangle indicates the area used for the analysis. (b) The Fourier transform of the NRA diffraction pattern. Both images are displayed on a logarithmic scale. (Inset) Optical microscope image of the NRA and its aperture separations shown in micrometers.
