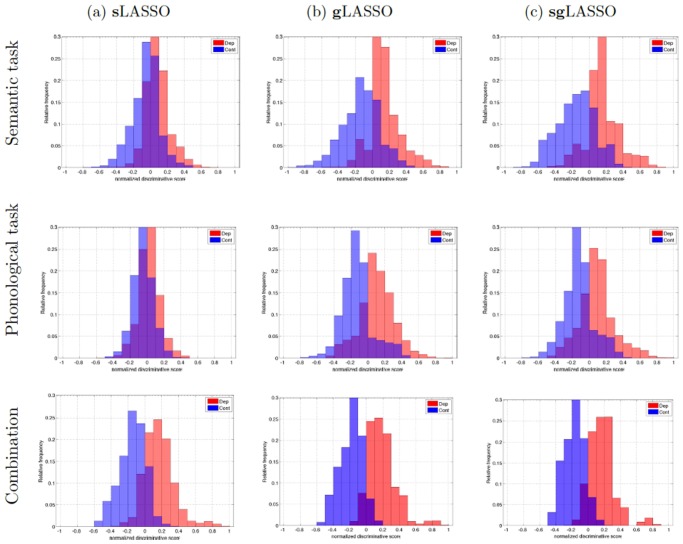
Fig 6. For all algorithms the separation of class probability distributions became clearer when semantic and phonological data were combined.
normalized discriminative score distribution was evaluated over all 1000 test datasets produced during the nested cross validation. The discriminative score is given by the logarithmic odds ratio and is here normalized by the maximum value of all test data.

