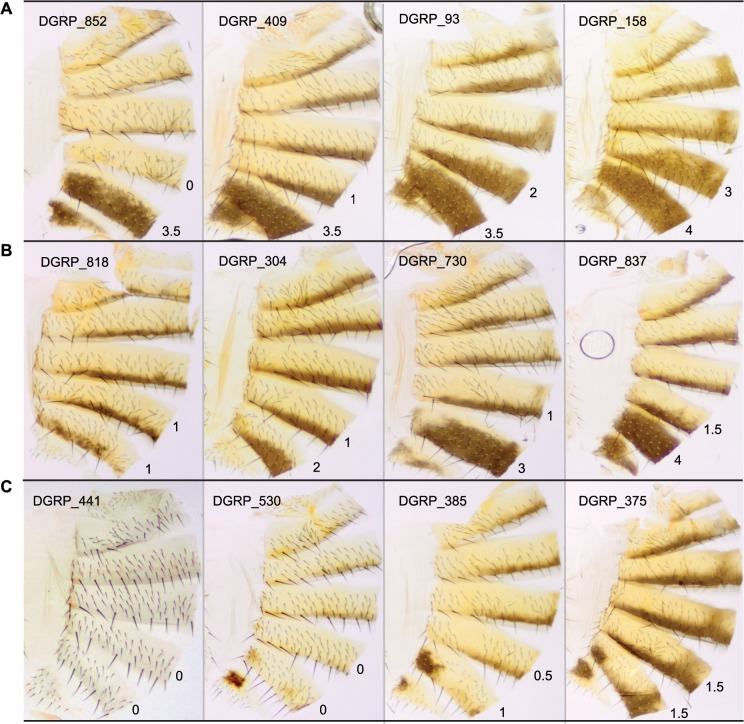
Fig 1. Natural variation in T5 and T6 pigmentation in the DGRP.
Images display one half of the fly abdominal cuticle, split along the dorsal midline. Pigmentation scores are given for T5 (upper) and T6 (lower). DGRP lines are denoted by DGRP_XXX in the upper left corner of each image. (A) Variation in T5. (B) Variation in T6. (C) Variation in spatial patterning of pigmentation.

