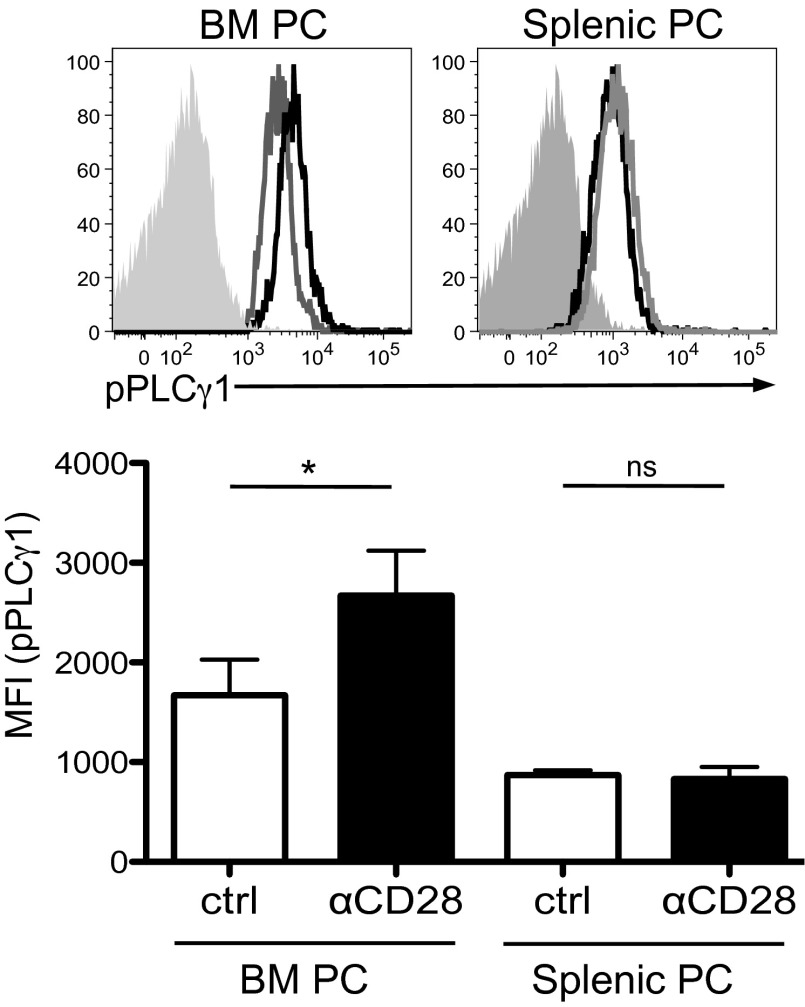
FIGURE 2.
Differential PLCγ signaling in BM versus splenic PC. BM and splenic PC were isolated and treated with αCD28 mAb or isotype control Ab for 15 min, fixed, gated on CD138+/B220− PC populations, and stained for phospho-PLCγ1. Top, Histograms representative of three independent experiments with the solid gray peak representing the isotype control, gray line the control Ig-treated group, and black the αCD28 mAb-treated PC. Bottom, Mean fluorescent intensity for pPLCγ1 is pooled for two wells for each experiment; data representative of three independent experiments. Statistical analysis done by one-way ANOVA (and nonparametric) with Newman–Keuls posttest. Data representative of two independent experiments. *p < 0.05.

