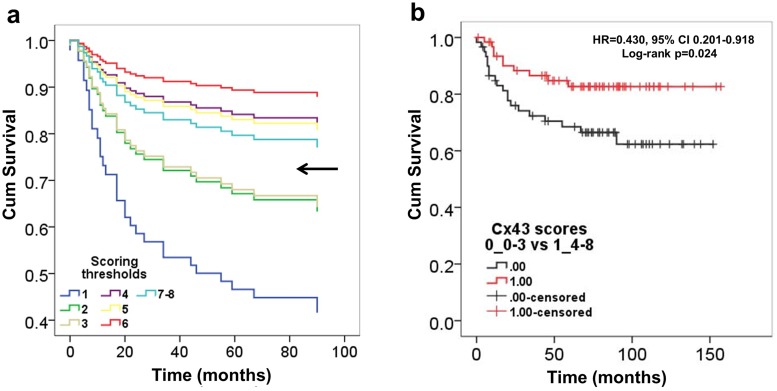
Fig 3. Kaplan-Meier plots of univariate Cox regression analysis of Cx43 immunoscores in giant cell tumor of bone.
An increased hazard of progression (reduced PFS) is linked to scores 1–3 vs 4–8 (arrow) separating patient number around the median, Nscore1-3 = 60 (48.8%), Nscore4-8 = 63 (51.2%) (a). Log-rank test proves significantly reduced progression free survival (PFS) in tumors presenting low (scores 1–3) vs high (scores 4–8) Cx43 protein levels (b).

