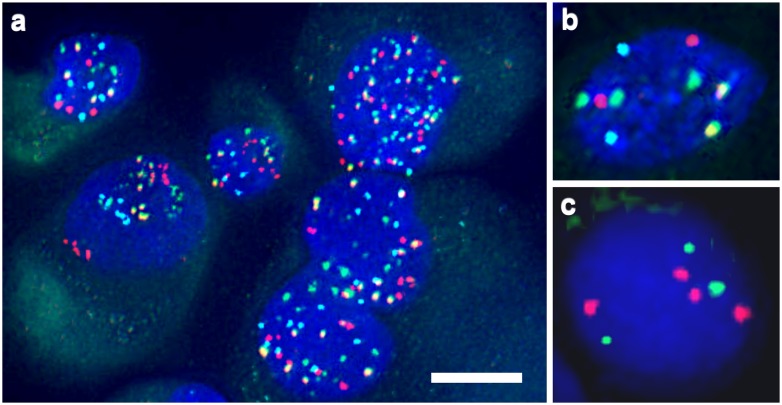
Fig 4. Examples of numerical chromosomal and telomeric alterations in GCTB stromal cells of male patients.
Centromeric 3 (red), 4 (green), 6 (yellow) and X (light blue) signals show different levels of polysomy. Chromosome 4 trisomy in a cell disomic for the rest (3,6 and X) of the tested centrosomes (b) and chromosome 11 subtelomeric loss and tetrasomy in a cell of another case (c). Scale bar on a represents 5 μm; and 2.5 μm on b and c.

