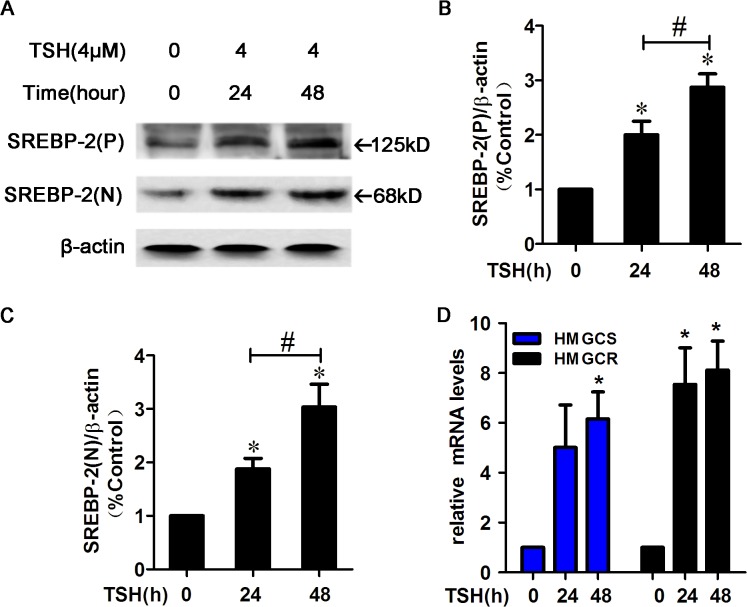
Fig 1. TSH increased SREBP-2 protein levels and the expression of its target genes, HMGCR and HMGCS, in HepG2 cells.
(A) HepG2 cells were pretreated with TSH (4 μM) for 24 or 48 h. Whole cell lysates were subjected to Western blotting (WB) using an SREBP-2 antibody that recognizes both the SREBP-2 precursor and nuclear active forms. (P) and (N) denote the precursor and nuclear active forms of SREBP-2, respectively. (B-C) Densitometric quantifications of SREBP-2 (P) and SREBP-2 (N) are shown. Densitometry was performed using ImageJ (version 1.45) and normalized to β-actin. The data are presented as the mean ± SEM. *p< 0.05 versus zero concentration of TSH, # p < 0.05 versus TSH (24h). (D) HepG2 cells were treated with TSH (4 μM) for 24 or 48 h and then were harvested to monitor the mRNA expression of HMGCR and HMGCS. β-actin was used for normalization, and the control was set to 1 in the Real-Time PCR data. All the experiments were performed in duplicate. *p < 0.05 versus zero concentration of TSH.

