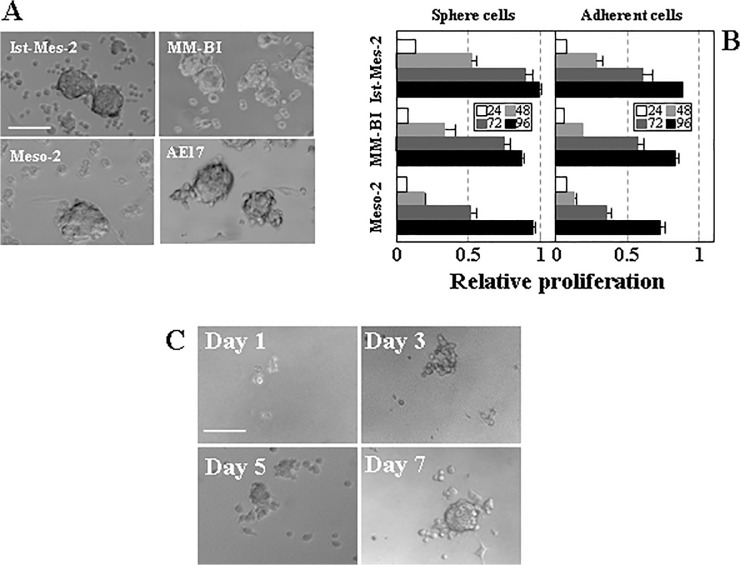
Fig 1. Mesothelioma cells form spheres with different intensity.
(A) Phase contrast images of mesospheres from established MM cell lines. (B) Proliferation rate of single cell-derived spheres re-cultured in normal differentiation medium compared to parental mesothelioma cells. For this experiment, cells were seeded at the same number into adherent medium, and proliferation of the initially adherent and sphere cells as evaluated using the MTT assay. The ratio of proliferation rate in sphere-derived adherent cells incubated for 72 h is 3.37 for Ist-Mes-2, 1.72 for Meso-2 and 4.25 for MM-BI cells. (C) A single Ist-Mes-2 cell was maintained in SFM and sphere formation on days 1, 3, 5 and 7 documented. The data in panel B are mean values ± S.D. derived from three independent experiments. Images in panels A and C are representative of three individual experiments. The scale bar in panels A and C represents 100 μm.

