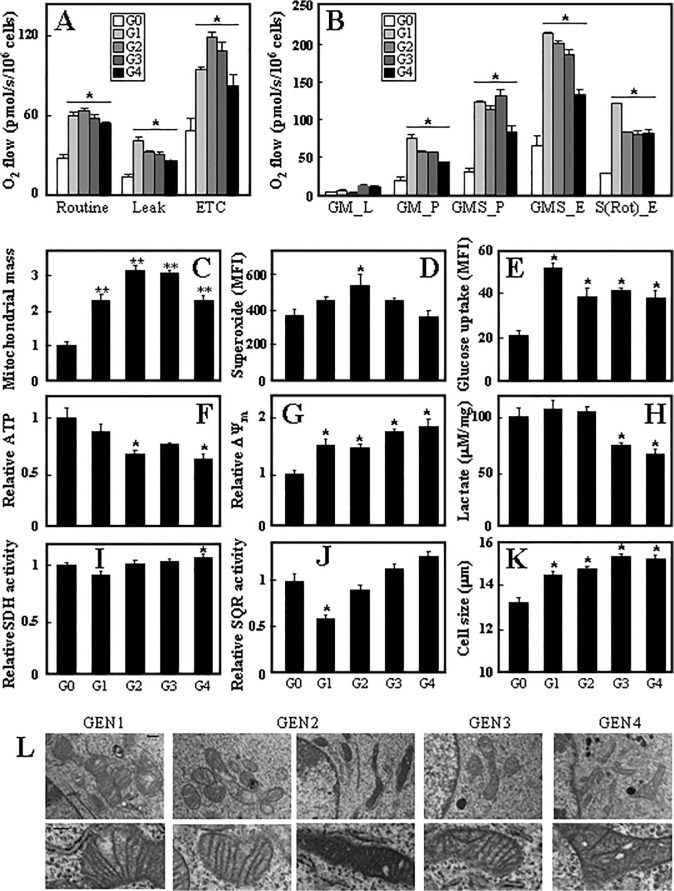
Fig 5. Mesospheres derived from different tumour generations show different mitochondrial features.
Sphere cells representing individual generations were evaluated for respiration using the routine protocol (A) and the protocol for permeabilised cells (B) by means of the Oxygraph 2k high resolution respirometer. The symbols GM_L, GM_P, GMS_P, GMS_E and S(Rot)_E represent routine respiration, respiration via complex I, respiration via complex I+II, uncoupled respiration and uncoupled respiration via CII, respectively. (C) Mitochondrial mass was evaluated using MitoTracker Green as detailed in the Methods section. Superoxide was evaluated using the fluorescent probe MitoSOX (D), glucose uptake using the fluorescent glucose analogue 2-NBDG (E), ATP levels by a luciferase-based assay (F), ΔΨm using the fluorescent probe TMRM (G), lactate levels using a commercial kit (H), for SDH (I) and SQR (J) activities using enzymatic assays, and hand-held cells counter for cell size (K). (L) TEM was performed on individual generation sphere cells as detailed in the Methods section. Data in panels A-K are mean values ±S.D., and are derived from three individual experiments. The symbol ‘*’ denotes statistically significant differences with p<0.05. Images in panel L are representative of three independent experiments. The white bar in panel K in the upper images represents 500 nm, in the lower images 200 nm.

