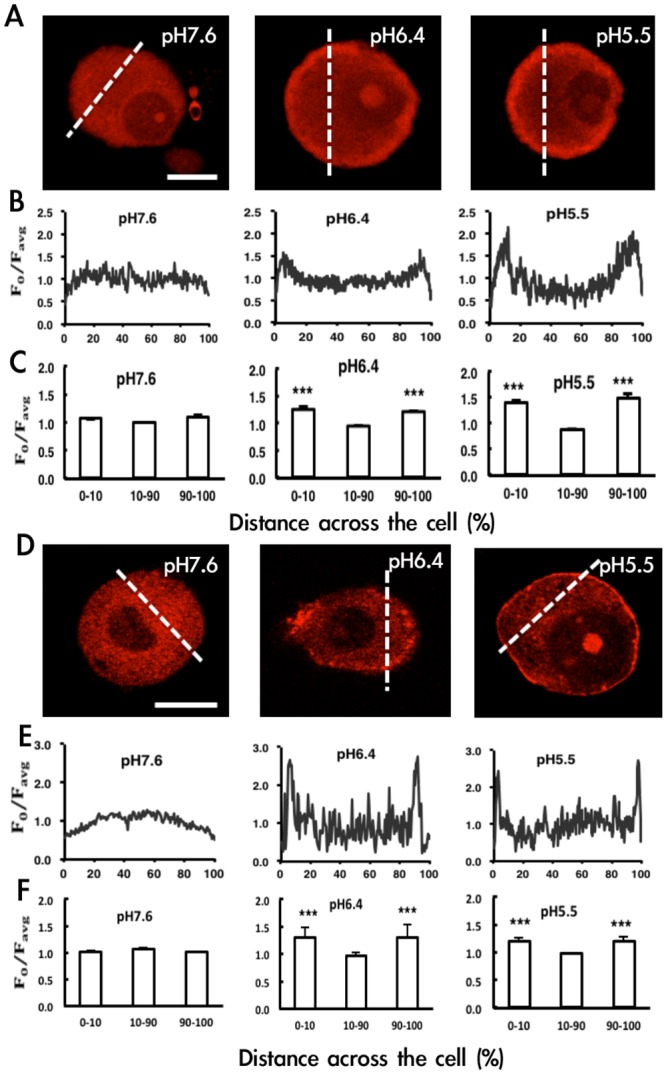
Fig 7. Acid induces PKA and PKCε translocation.

Primary dorsal root ganglia (DRG) from CD1/ICR mice were cultured for 12~16 h, then stimulated with acid solution, pH 7.6, 6.4 or 5.5 for 5 or 30 min or 15 s, respectively. After immunostaining with anti-PKA or anti-PKCε antibodies, cell images with red fluorescence for PKA (A) or PKCε (D) were observed by confocal microscopy. Bar = 10μm. (B, C, E, F) Fluoresence intensity (F0) in a line bisecting the neuronal soma (see dashed line in A, D) was measured and the profile of intensity (F0/Favg) is shown in B, E. Favg = the mean intensity of the dashed line. Lines were positioned to avoid nuclei. Fluorescence intensity within the peripheral (0–10% and 90–100% of cell distance) region was the membrane fraction and within the central region (10–90% of cell distance) the cytosolic fraction. Shows the mean intensity of membrane or cytosolic fractions (n = 3) (C, F). ***P<0.001 compared to cytosolic fraction (10–90%) by one-way ANOVA with a post-hoc Bonferroni test.
