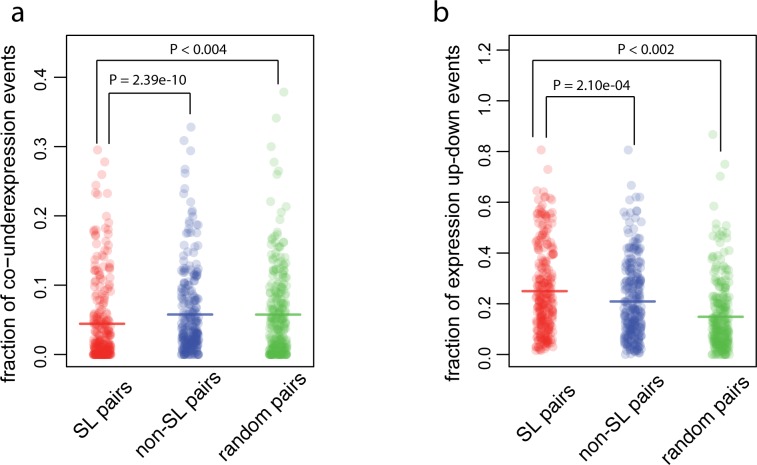
Fig 3. SL pairs are reflected in gene expression variations.
(a) SL pairs are less likely to be co-underexpressed relative to the control i.e., non-SL or random pairs. The fraction for co-underexpression events is described as f4 in methods and Fig 1. (b) SL pairs are more likely to have expression up-down events where one gene is over-expressed while the other in under-expressed. The fraction for such pattern is described as f5 in Methods and Fig 1. Each dot is the fraction for a given pair and the horizontal bar represents the mean of the fractions. P-values for the comparison between SL and non-SL pairs were calculated with a one-sided Wilcoxon rank test. P-values for the comparison between SL and random pairs were calculated from 1000 randomizations. P-values were adjusted for multiple comparisons using the Bonferroni correction (for details see Methods).

