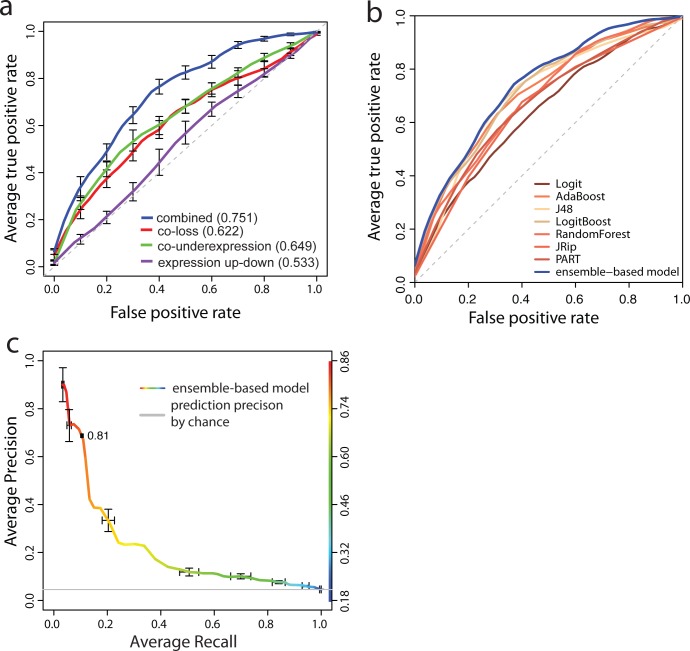
Fig 4. Receiver operating characteristic (ROC) curves.
(a) The ensemble-based prediction model based on all five combined patterns has an area under curve (AUC) of 0.75 (blue line), which is estimated by 10-fold cross validation. Ensemble-based prediction models based on the non-combined individual patterns, i.e., co-loss in CNVs, co-underexpression and expression up-down, are shown in red, green and purple respectively, and have lower AUCs. Standard error bars are added to each ROC. (b) The ensemble-based prediction model (the blue ROC curve) has a better performance than all the seven single. (c) The precision and recall curve is estimated from 10-fold cross validation. Standard error bars are added. The curve is colored according to the cutoff of probability. The color panel of the probability is plotted at the right side. The cutoffs of probability scores (p(x)), 0.81, are printed at the corresponding curve positions. The grey line represents the prediction precision by chance alone.

