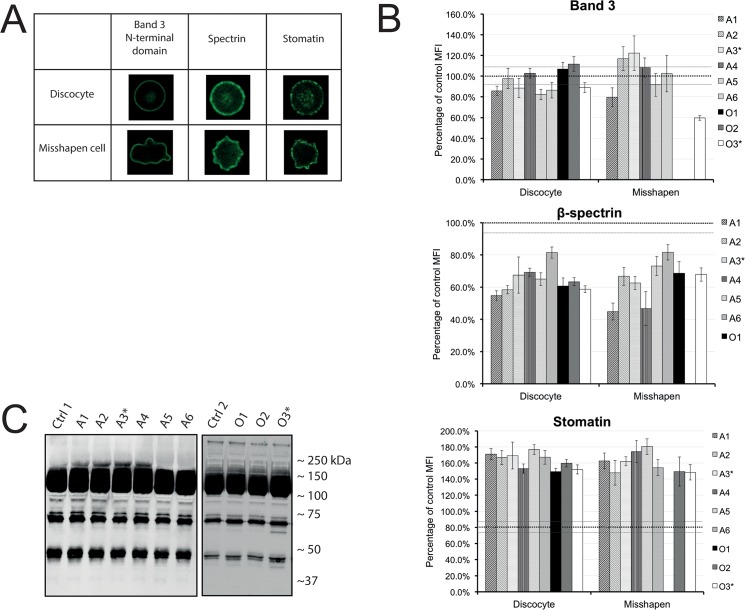
Fig 2. Quantitative and qualitative analysis of the main components of the membrane-cytoskeleton complex.
(A) Confocal microscopy was used to categorize the red blood cells by their cell shape in discocyte versus misshapen cells. Immunofluorescence staining of band 3, spectrin and stomatin showed that the distribution of these proteins is similar in healthy looking cells and misshapen cells. (B) Quantitative image analysis of at least 25 cells was used to determine the mean fluorescent values of antibodies against band 3, β -spectrin and stomatin in relation to the control samples (dotted black line at 100%). Error bars represent the standard error. The grey dotted line depicts the standard error of the controls. (C) Band 3 in membrane fractions. Western blot staining with an antibody against the N-terminal domain of Band 3 (see also S2 Fig). Aberrant degradation patterns are seen in the 40 and 70 kDa area.

