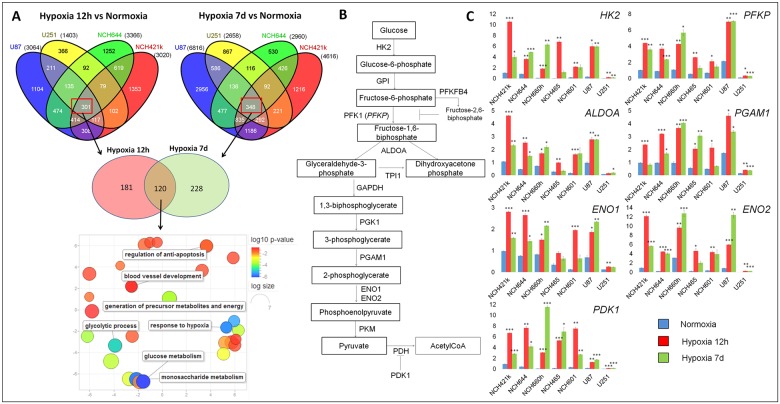
Fig 1. Glycolysis-related genes are up-regulated in glioblastoma cells under hypoxia.
A. Stem-like (NCH644, NCH421k) and classical adherent (U87, U251) glioma cells were cultured in 0.1% O2 for short term (12 hours = 12h) and long term (7 days = 7d). Differentially expressed genes (DEGs) were established between hypoxic and normoxic cells (n = 3–6). Venn diagrams (top) represent analysis of DEGs after 12h and 7d respectively (FDR<0.001; any fold change (FC)). Red squares highlight the genes commonly modulated in all four glioma cell lines. 120 genes were commonly deregulated upon 12h and 7d hypoxia (Venn diagram, middle) which were strongly associated with glycolysis (9 genes) and glucose metabolism (11 genes) (Revigo representation of significant GO terms, bottom). B. Schematic representation of the glycolytic pathway and associated enzymes. HK2 = hexokinase 2; PFK1 = phosphofructokinase 1 (encoded by PFKP = Phosphofructokinase, platelet); ALDOA = aldolase A; PGAM1 = phosphoglycerate mutase 1; ENO1 = enolase 1; ENO2 = enolase 2; PDH = pyruvate dehydrogenase; PDK1 = pyruvate dehydrogenase kinase 1. C. Quantitative PCR analysis of glycolytic gene expression in adherent glioma cells (U87 and U251) and glioma stem-like cells (NCH421k, NCH644, NCH660h, NCH465 and NCH601), under normoxia and hypoxia (12h and 7d). Data are presented as mean +/- SEM (n = 3). Data were normalized against EZRIN expression. NCH421k cells were used as an internal calibration (value = ‘1’); * p<0.05; p**<0.01; p***<0.001.

