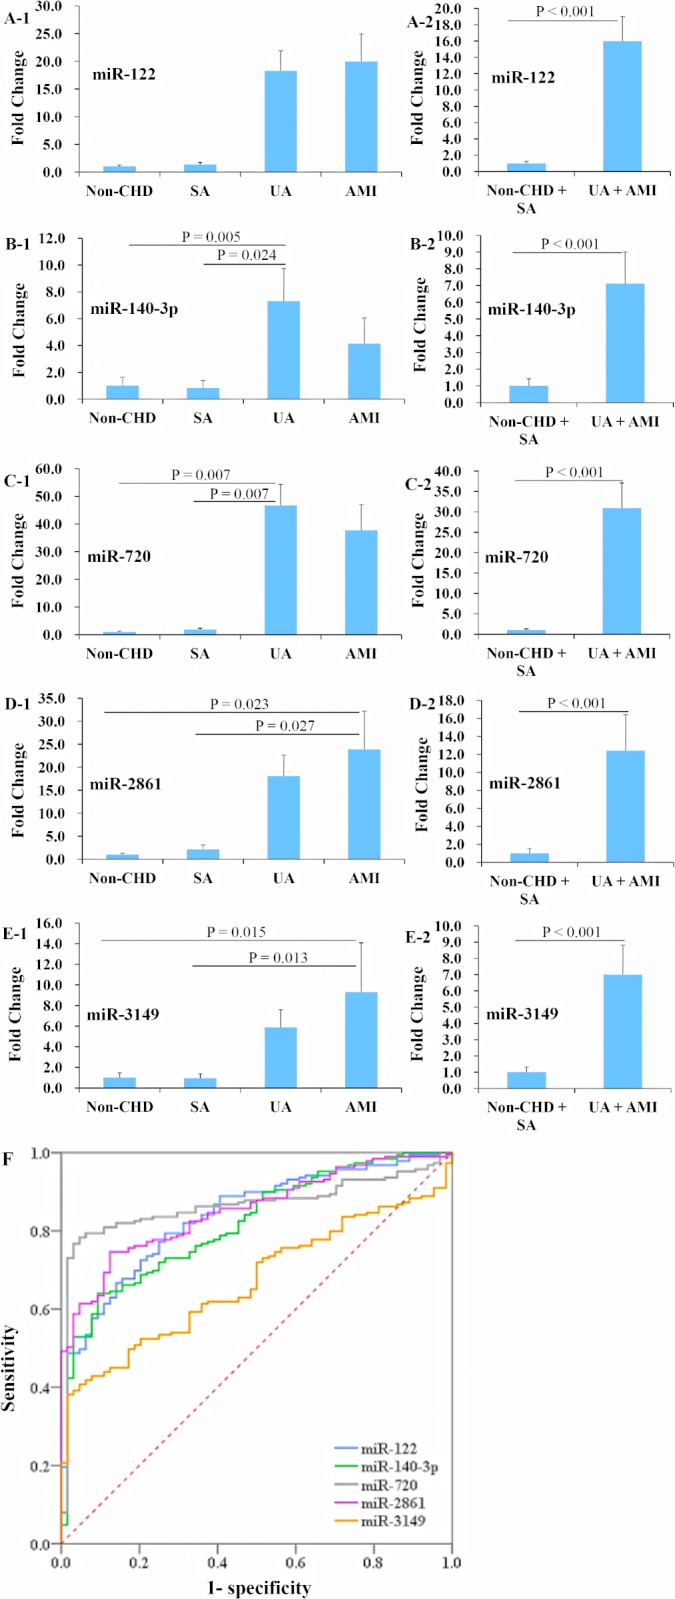
Fig 3. Expression profiles of plasma miR-122, -140-3p, -720, -2861, and -3149 in ACS and non-ACS patients in the training data set.

A total of 539 plasma samples were used for the training data set in deriving the miRNA panel for use in the classification of ACS and non-ACS. The expression levels of miR-122, -140-3p, -720, -2861, and -3149 were dramatically elevated in the ACS (UA + AMI) group compared with the non-ACS (non-CHD + SA) group (A to E). The determination values of these five plasma miRNAs were analyzed by ROC curves (F). Abbreviations as in Fig 1.
