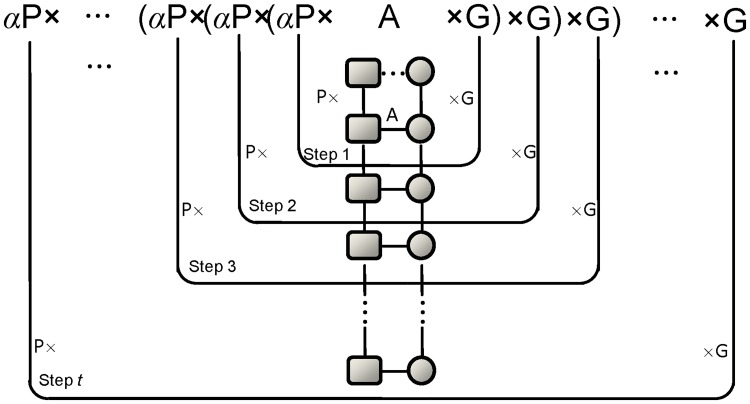
Fig 3. Illustration of bi-random walk.
P and G are the affinity matrices of the phenotype network and the gene network, respectively. A is the bipartite graph of the known phenotype-gene association from OMIM. By iteratively extending the phenotype path and the gene path (achieved by multiplying P on the left or G on the right in each step), the algorithm explores the CBGs weighted by a decay factor α ∈ (0,1). The dashed edge indicates a potential association to add into the network. The iterative algorithm finds the number of new CBGs formed by introducing this additional connection. In other words, a potential association is evaluated by its distance to the known associations in the phenotype network and the gene network.

